
As previously introduced by Jiaolian, none of the 30 so-called on-chain top escape indicators indicate a peak, but the market has begun to fall and the trend has reversed, which is unsettling.
Jiaolian saw that well-known crypto analyst @ali_charts posted a post pointing out that BTC has seen 5 major peak selling indicators.Let’s look at them one by one to see if these indicators make sense.(Early warning: Jiaolian has said that all indicators are lagging indicators. Do not use them as investment advice or investment guides!)
The first indicator: monthly MACD.
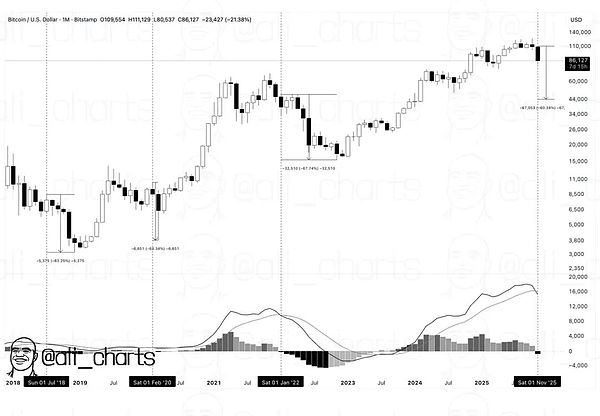
Analysts pointed out that this is the first time since January 2022 that the monthly MACD has turned bearish.In history, after the monthly MACD turned bearish for the past three times, BTC has experienced an average decline of more than 60%.If it remains the same this time, the target price will be $40,000.
Reflection:
“It’s the same every time” and “It’s different this time” are really two classic myths among investors.
Cunning people say, “History never simply repeats, but it always rhymes.”
Second indicator: death cross.
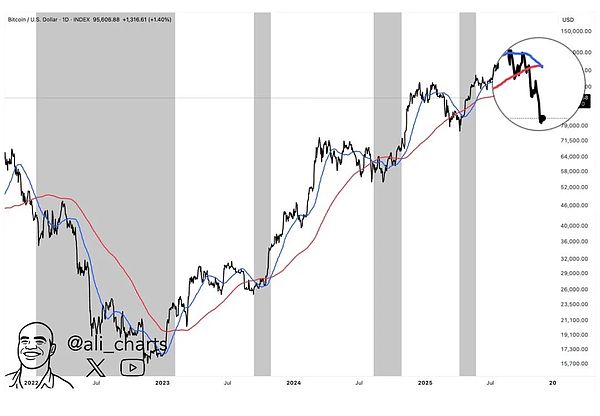
Analysts pointed out that BTC’s 50-day moving average has crossed downwards through the 200-day moving average, forming a so-called death cross.In the past year, every death cross has formed a local bargaining opportunity; however, the death cross in 2022 has started a bear market.
Reflection:
Therefore, it is actually an ambiguous signal.
However, the signal occurs at the waist and tail of the cycle, so maybe the probability of risk occurrence is also different, right?
The third indicator: falling below the 50-week moving average support.
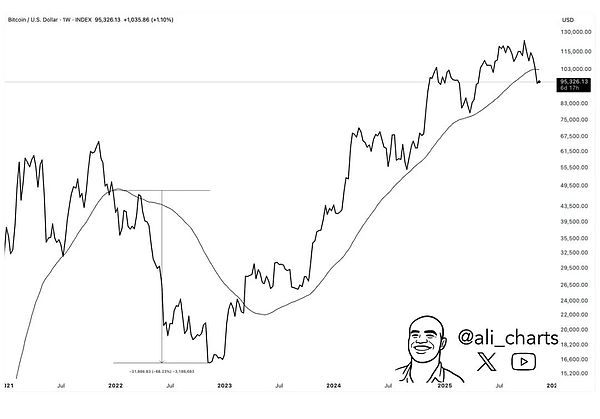
Analysts pointed out that BTC effectively fell below the 50-week moving average (which is actually roughly equivalent to the annual moving average, because 50 times 7 equals 350, which is close to 365 days in a year). The last time it effectively fell below was in 2022, which directly started a bear market.
Reflection:
Unfortunately, there is only one historical reference point.
Humans are particularly good at overfitting.From one or two data reference points, you can summarize the “laws”!
Fourth Indicator: The weekly “Super Trend” indicator issues a sell signal.
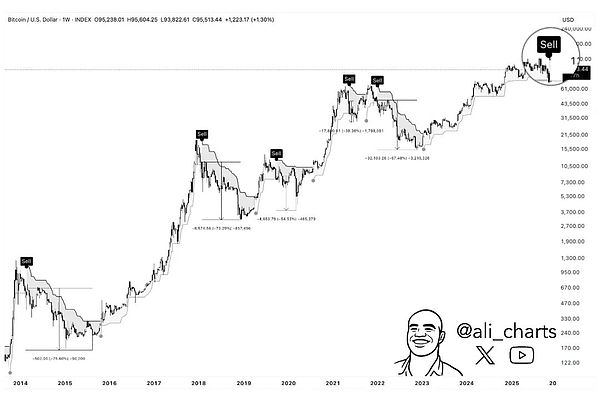
Analysts pointed out that the weekly “super trend” indicator has issued a sell signal, and the historical effect of this indicator seems to be quite “accurate”.
Reflection:
Technical indicators are always “accurate” – especially when we look in the “rearview mirror.”
If you cannot thoroughly understand and grasp how a technical indicator is calculated and what it means, then it is best not to believe or deny it based on superficial phenomena.
Fifth indicator: The bi-monthly “TD Sequence” indicator issues a sell signal.
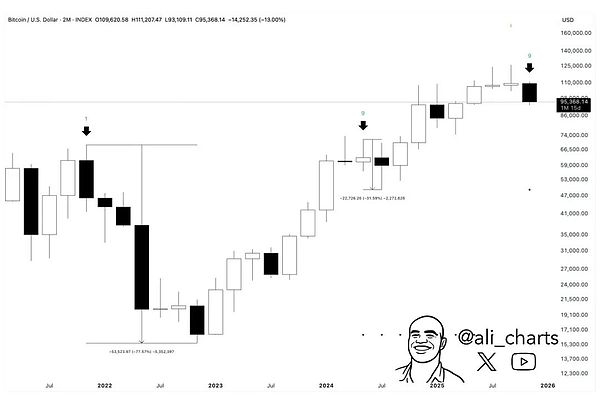
Analysts pointed out that the past two sell signals on this indicator (at the end of 2021 and mid-2024) were accompanied by deep corrections of 78% and 32% respectively.
Reflection:
There are thousands of technical indicators, why can we always pick out “top students” when we carefully select them?Maybe this is where the “survivor bias” effect is serious?
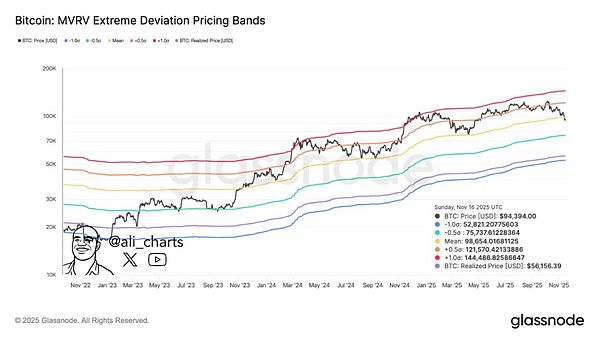
Finally, analysts pointed out based on several standard deviation curves of MVRV that the support levels below the mean value of $98,650 may be: -0.5 standard deviation at $75,740; -1 standard deviation at 52,820.
Jiaolian’s consistent attitude towards technical indicators is that they should not be taken lightly.In particular, the more well-known an indicator is, the greater the deviation between its backtest accuracy and future accuracy may be.
Rather than being superstitious and chasing so-called indicators to decide your own operations, it is better to build a solid bottom position, do not chase highs in bull markets, dare to take action in bear markets, do not rush to buy bottoms, be able to hold on to the main rise, always do a good job in position management, be calm and comfortable, applaud when it rises, and add positions when it falls.


