Author: David
At 5 a.m. on November 13, Beijing time, a government shutdown crisis that lasted for 43 days and set a record in American history was about to come to an end.
beautyThe House of Representatives passed the temporary appropriation bill by a vote of 222-209 on the evening of November 12, local time.and signed by Trump.
At this point, the shutdown stalemate that began on October 1 came to an end.
Over the past 43 days, flights have been widely delayed, food aid programs have been disrupted, economic data releases have been suspended, and uncertainty has enveloped every aspect of the world’s largest economy.
And how will the market react as the shutdown ends?
For investors in the crypto market and traditional financial markets, this is not only the end of a political event, but also an experimental window to observe how asset prices respond to the “elimination of uncertainty.”
Historical data shows thatAfter the past several major U.S. government shutdowns ended,US stocks, gold, and Bitcoin all show different trend characteristics..
This time, when the government reopens and federal funds flow again, what assets are likely to benefit?
If you don’t have time to read, the picture below can help you quickly grasp the key points.
Below are more details to help you learn from history and become a smart investor.
How will the shutdown affect investment?
To understand the market reaction after the shutdown ends, we must first understand:How exactly does the government shutdown affect asset prices?
A government shutdown is by no means as simple as “civil servants taking a holiday.”
According to estimates from the U.S. Congressional Budget Office (CBO), the 35-day shutdown in 2018-2019 resulted in approximately$3 billion in perpetuityGDPloss,There is also about $8 billion in temporary delays in economic activity.
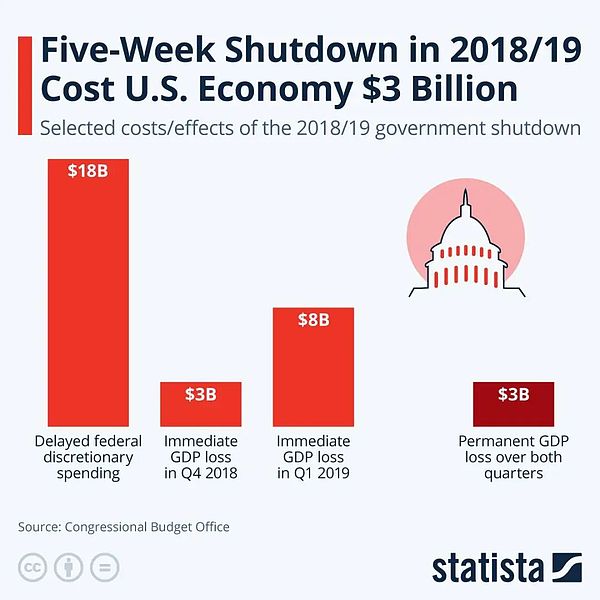
This round of 43-day shutdown broke the historical record.While CBO has not yet released an economic impact assessment of this shutdown, given its longer duration and wider impact, the economic losses are likely to be significantly greater than those in 2018-2019.
The reduction in real economic activity will be reflected in key indicators such as GDP growth rate, consumption data, and corporate profits.
But more important than the financial losses is the uncertainty itself.
One of the core logics of financial markets is that investors hate uncertainty.
When the future is unpredictable, funds tend toReduce holdingsHigh-risk assets (technology stocks,growth stocks),OverweightSafe haven assets (gold,U.S. debtetc.), reduceLeverage, hold cash and wait and see.
So conversely, what happens when the shutdown ends?In theory, the end of the shutdown means:
-
return to policy certainty– Government funding is secured, at least for the next few months
-
Economic data resumes release– Investors regain the tools to judge economic fundamentals
-
financial expenditureRestart– Delayed purchases, wages, and welfare benefits have begun to be paid, providing a short-term boost to the economy
-
Risk Appetite Fix– The worst-case scenario is lifted and funds return to chasing returns
This often triggers a “relief rally” because the removal of uncertainty is a boon in itself.
But it should be noted that this rebound may not last long.
After the shutdown ends, the market will quickly return to paying attention to economic fundamentals; therefore, we believe that the impact of the shutdown on the market can be divided into two levels:
-
Short term (1-2 weeks): Sentiment repair brought about by the elimination of uncertainty, usually positive for risk assets
-
Medium term (1-3 months): Depends on whether economic fundamentals are really damaged, as well as other macro factors
For the encryption market, there is another special consideration:Regulatory agencies resume operations.
Agencies such as the SEC and CFTC have largely come to a standstill during the shutdown, with approval processes suspended and enforcement actions delayed.When the government reopens, how these institutions will “make up for classes” is also a variable worthy of attention.
Next, let’s look at historical data to see how U.S. stocks, gold, and Bitcoin have actually performed after the past few major shutdowns ended.
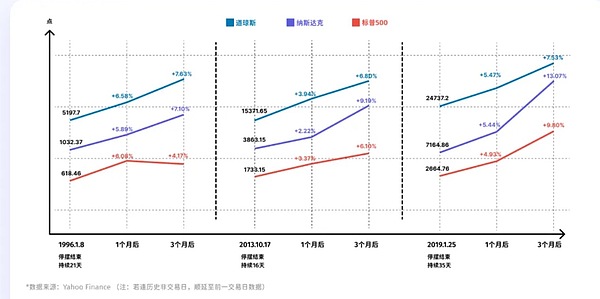
U.S. stock market historical review: After the shutdown ends, there is always a “relief rebound”
Let us focus on three shutdown events that lasted for a long time and had a significant impact on the market, and see how investors responded by investing real money in the U.S. stock market when the government reopened.
You can see:
1. December 1995 Lockout (21 days): Eve of the tech bubble, modest gains
On December 16, 1995, the Clinton administration and the Republican-controlled Congress reached an impasse over a plan to balance the budget, forcing a government shutdown.
Market performance:
-
1 month later:S&P 500 rises to 656.07(+6.1%), Nasdaq 1093.17(+5.9%), Dow Jones 5539.45(+6.6%);
-
3 months later:S&P 500 reported 644.24(+4.2%), Nasdaq 1105.66(+7.1%), Dow Jones 5594.37(+7.6%);
This is more like a typical rise first and then adjustment.One month after the shutdown, the three major indexes all recorded a rebound of about 6%, but the gains narrowed by three months, and the S&P 500 even fell back from its one-month high.
Although it is old, but combined with the political and economic environment at the time, the reason behind it may be that the market returned to fundamental pricing after digesting the short-term benefits of the end of the shutdown.
The beginning of 1996 was the beginning of the “golden age” of the U.S. economy. With the emergence of personal computers and the Internet, technological development was in its infancy, and inflation was moderate. The market itself was on a long-term upward path, and the disruption of the shutdown was more like an episode.
2. Lockout in October 2013 (16 days):US stocksBreaking through the pre-financial crisis high
On October 1, 2013, another government shutdown occurred when Republicans attempted to use a shutdown to force the Obama administration to delay implementation of the Affordable Care Act.The shutdown lasted 16 days, with an agreement reached in the early hours of October 17.
Market performance:
-
1 month later:S&P 500 rises to 1,791.53(+3.4%), Nasdaq 3949.07(+2.2%), Dow Jones 15976.02(+3.9%)
-
3 months later:S&P 500 reported 1838.7(+6.1%), Nasdaq 4218.69(+9.2%), Dow Jones 16417.01(+6.8%)
This shutdown occurred at a special historical node: October 2013 was the moment when U.S. stocks emerged from the shadow of the financial crisis and broke through the 2007 high.
The end of the shutdown occurred almost simultaneously with the technical breakthrough, coupled with the QE3 quantitative easing being implemented by the Federal Reserve at the time, the market sentiment was extremely optimistic.The Nasdaq is up nearly 10% in 3 months, clearly outperforming traditional blue-chip stocks, with technology stocks once again spearheading the rebound.
3. Lockout in December 2018 (35 days):bear marketBottom reversal, the strongest rebound from the shutdown
On December 22, 2018, Trump entered into a stalemate with Democrats over his insistence on $5.7 billion in funding for a U.S.-Mexico border wall.The standoff lasted until January 25, 2019, setting a record for the longest lockout in history at the time (35 days), which was not surpassed until the current 42-day lockout.
Market performance:
-
1 month later:S&P 500 rises to 2796.11(+4.9%), Nasdaq 7554.46(+5.4%), Dow Jones 26091.95(+5.5%)
-
3 months later:S&P 500 reported 2926.17(+9.8%), Nasdaq 8102.01(+13.1%), Dow Jones 26597.05(+7.5%)
This is the strongest rebound among the three lockouts, and there are special reasons behind it.
In the fourth quarter of 2018, U.S. stocks plummeted nearly 20% from their highs due to the Federal Reserve’s interest rate hikes and trade frictions, hitting a periodic low on December 24.
The shutdown ends almost simultaneously with the market bottom, coupled with the Federal Reserve’s subsequent policy shift to suspending interest rate increases, the dual benefits may have promoted a strong rebound.
Nasdaq’s 13% gain in three months once again confirmed the high resilience of technology stocks in the risk appetite repair phase.
Looking back at the historical data of U.S. stocks after the shutdown, three clear patterns emerged:

First, short-term rebound is a high-probability event.Within one month after the three shutdowns ended, all three major indexes rose, with an increase of between 2% and 7%.The elimination of uncertainty is a boon in itself.
Second,technology stocksOften beats the market.Nasdaq’s 3-month gains were 7.1%, 9.2%, and 13.1%, respectively, which were significantly higher than the Dow Jones’ gains of 7.6%, 6.8%, and 7.5%.
Third, the medium-term trend depends on the macro environment.The performance in the 1-3 months after the end of the shutdown varied greatly. The first increase and then adjustment in 1996, the continuous rise in 2013, and the strong rebound in 2019 all had their own macro logic behind them, not the shutdown itself.
Gold history review: The trend does not depend on the shutdown itself
When we turn our perspective to gold, we find a completely different story than the stock market.
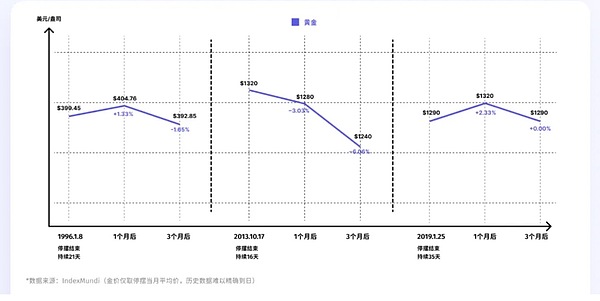
1. December 1995 Lockout (21 days): Small swing
Gold price performance:
-
Lockout is over(January 1996): $399.45/oz.
-
1 month later(February 1996): $404.76 (+1.3%)
-
3 months later(April 1996): $392.85 (-1.7%)
The political event of the shutdown had a minimal impact on gold prices.
2. October 2013 shutdown (16 days): ongoingcallback
Gold price performance:
-
Lockout is over(October 2013): $1320/oz.
-
1 month later(November 2013): $1280 (-3.0%)
-
3 months later(January 2014): $1240 (-6.1%)
This was gold’s weakest performance of the three shutdowns.2013 was a bear market year for gold, falling from $1,700 at the beginning of the year to $1,200 at the end of the year, a drop of more than 25% for the year.
The reason behind this is that the Federal Reserve began to discuss tapering quantitative easing, and the strength of the US dollar suppressed gold prices.After the shutdown ended, as uncertainty receded, gold’s safe-haven properties further weakened and prices accelerated their decline.
3. Lockout in December 2018 (35 days): rise first and then recover
Gold price performance:
-
Lockout is over(January 2019): $1290/oz.
-
1 month later(February 2019): $1320 (+2.3%)
-
3 months later(April 2019): $1290 (0%)
During this shutdown, U.S. stocks experienced a plunge at the end of 2018, and rising risk aversion drove gold prices from $1,230 to $1,290.After the shutdown ended, gold prices briefly shot up to $1,320, but as stocks rebounded and risk appetite returned, gold prices fell back to where they were when the shutdown ended, marking a three-month gain or loss of zero.
In the 2013 and 1996 shutdowns, stocks rose 3-6% after the shutdown ended, while gold either fell (-6.1% in 2013) or was choppy and flat (-1.7% in 1996).
This is also consistent with the subjective perception that funds will flow from safe-haven assets to risky assets when uncertainty is eliminated and risk appetite rebounds.
If history repeats itself, gold may face the following two scenarios after this 42-day lockout ends:
Scenario 1: Risk aversion fades rapidly.If gold prices have already risen due to safe-haven demand during the shutdown, the end of the shutdown may trigger “profit taking” and a short-term correction of 5-10% in gold prices.Nowhere is this more evident than in the 2013 case.
Scenario 2: Macro risks have not been eliminated.If the shutdown ends, but macro concerns such as U.S. fiscal problems, the debt ceiling, and the risk of recession remain, gold may remain strong or even continue to rise.
After all, the shutdown is only temporarily over.
Judging from the current gold price,The end of the shutdown may ease short-term safe-haven demand, but it will be difficult to change gold’s long-term upward trend.
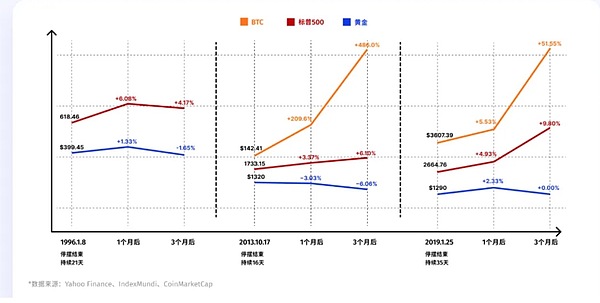
BTC historical review: limited sample, but still enlightening
Finally, we get to the biggest question among crypto investors: What will happen to Bitcoin after the shutdown is over?
Frankly, the historical sample is extremely limited.Bitcoin did not exist when the shutdown occurred in 1996. When the shutdown occurred in 2013, the market value of BTC was too small and it was in the midst of a super bull market. The only ones with real reference value wereThat time in 2018-2019.
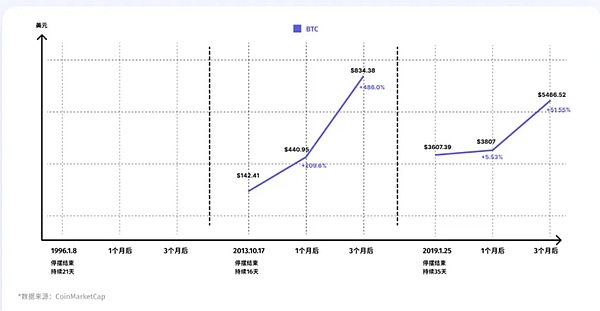
1. Lockout in October 2013 (16 days):bull marketInterlude, has little to do with the shutdown
BTC Price Performance:
-
Lockout is over(2013-10-17):$142.41
-
1 month later:$440.95(+209.6%)
-
3 months later:$834.48(+485.9%)
This data seems extremely exaggerated, with a three-fold increase in one month and a nearly six-fold increase in three months.
2013 was one of the craziest bull market years in Bitcoin history, with prices soaring more than 5,000% throughout the year, from $13 at the beginning of the year to a peak of $1,147 at the end of the year.
October is the acceleration period of this super bull market.BTC had just experienced a plunge after the “Silk Road” was seized by the FBI. After a brief panic, the market quickly rebounded and started the craziest stage of peaking.
But this shutdown has almost no causal relationship with BTC trends. The government shutdown is more like a noise-level event in the price logic of BTC.
2. Lockout in December 2018 (35 days):bear marketBottom, key turning point
BTC Price Performance:
-
Lockout is over(2019-01-25):$3607.39
-
1 month later:$3807 (+5.5%)
-
3 months later:$5466.52(+51.5%)
In December 2018, BTC was in the bottom territory of a lengthy bear market.From a high of $19,000 in December 2017, BTC has plummeted more than 80%, hitting a stage low of $3,122 on December 15, 2018.The shutdown began (December 22nd) almost simultaneously with BTC bottoming.
Within 1 month after the shutdown ended, BTC only rebounded modestly by 5.5%, which was much lower than the 4.9-5.5% increase in US stocks;
But by 3 months, BTC was up 51.5%, significantly outperforming the S&P 500’s 9.8% and Nasdaq’s 13.1%.
There are several key factors behind this:
First, the bottom reversal logic of BTC itself.At the beginning of 2019, a consensus emerged in the crypto market that “the worst has passed”: miners surrendered, retail investors left the market, but institutions began to make arrangements.
Secondly, the improvement of the macro environment.The Federal Reserve issued a dovish signal at the beginning of 2019 and global liquidity is expected to improve, which is positive for the high-risk asset BTC.
Third, the market value of BTC was about US$60 billion at the time, which was much smaller than the stock market, had poorer liquidity, and therefore was more volatile.When risk appetite returns, BTC is naturally more resilient.
Comparing the performance of gold and the stock market, Bitcoin shows more of the result of the superposition of macro Beta + its own cycle.
In the short term, BTC looks like a high-beta risky asset.
After the shutdown ended, when uncertainty dissipated and risk appetite returned, BTC’s rebound (12%) was close to that of the Nasdaq (5.4%) and well ahead of gold (2.3%).This shows thatIn the time dimension of 1-3 months, the pricing logic of BTC is closer totechnology stocks, rather than safe-haven assets.
But in the medium to long term, BTC has its own cycle.After rising to $5,200 in April 2019, BTC continued to rise to $13,800 in June, a rise far greater than any traditional asset.The core driver of this round of rise may come from the approach of the four-year halving cycle, followed by the entry of institutions and large companies.
Whether the government shuts down or not has little impact.
Looking ahead, how will BTC react if this 42-day lockout ends?
Short term (1-2 weeks): If the end of the shutdown triggers a “relief rebound” in US stocks, BTC is likely to rise accordingly;
Medium term (1-3 months): The key depends on the macro environment.If the Fed remains accommodative, economic data is not bad, and there is no new political crisis, BTC may extend its gains.
But don’t forget that there is currently no breakthrough narrative in the crypto market, and it is unlikely to expect the price of BTC to be driven endogenously.
The lockout is over and the game continues
The 42-day shutdown is coming to an end, but this is not the end, but the beginning of a new round of market changes.
Looking back at history, the market usually rebounds in the short term after the shutdown ends; but the sustainability of this rebound needs to be viewed rationally.
Don’t rush into FOMO when you see the market rising 5% after the shutdown ends, and don’t panic sell when you see a short-term pullback in BTC.
Stay rational, pay attention to fundamentals, and manage risks well. Our principles will not change due to the shutdown.
Events can be changed, but the game will continue.