Source: Coinbase Research; Compiled by: Bitcoin Vision
Summary:
Following the massive liquidation event on October 11, Coinbase believes that the cryptocurrency market has bottomed out and the position structure is now significantly clearer.The market appears to be just resetting rather than crashing.We believe the sell-off has returned system leverage levels to structurally healthier levels, which could provide directional support in the short to medium term.Despite this,A slow recovery is more likely than a surge to new all-time highs in the coming months.
Mechanically, the deleveraging event was more of an adjustment of the market mechanism than a test of solvency, although it did put pressure on the riskiest sectors of the cryptocurrency market, causing altcoins to plummet and market makers to withdraw their quotes.But on the positive side, we believe the technical driver of this move means the fundamentals of the cryptocurrency market remain solid.Institutional investors – many of whom have not been exposed to leverage – are likely to lead the next leg of the rally.We believe that although the macro environment is highly complex and risks are higher than at the beginning of the year, it remains supportive for the cryptocurrency market.
According to Nansen’s report, “smart money” in the space has flowed to EVM stacks (e.g., Ethereum, Arbitrum), while Solana and BNB chains have lost momentum.Still, we use the flow of smart money as a filter, rather than a buy signal, to identify where market depth, incentives, and developer/user activity converge across different protocols, decentralized exchanges (DEXs), and blockchains.At the same time,Stablecoin data shows capital rotation rather than new money infusions, which means that in the short term, the rally will still rely on strategic incentives and narrative-driven capital rotation.
food heist
There is a popular anecdote among commodity traders, often referred to as “The Great Grain Robbery.”This happened in 1973 and, despite the name, was not actually a real robbery.Rather, it was the Soviet Union’s methodical and secretive removal of wheat and corn stocks from the open market over the course of a month.The incident did not attract much attention at first, and it was not until global food prices soared by 30% to 50% that people realized that the Soviet Union was suffering from massive crop failures, causing global food supplies to fall to dangerously low levels.
The wave of cryptocurrency liquidations triggered by the Oct. 11 tariffs—which sent many altcoins down 40% to 70% in price—bears a striking resemblance to the information dynamics at the time.In both cases, information asymmetries during periods of illiquidity caused huge market disruptions, with illiquid, high-beta assets suffering disproportionately.
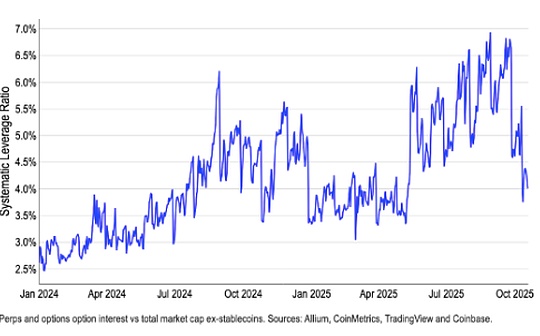
Chart 1. Largest liquidations in recent cryptocurrency history
In 1973, U.S. officials failed to recognize global food shortages because of inadequate agricultural monitoring systems, leading Senator Henry Jackson to accuse them of either “gross negligence” or “deliberate concealment.”This incident prompted the development of satellite crop monitoring technology to prevent future information asymmetries.
In the case of cryptocurrencies, this wave of selloffs is not simply an information gap, but a problem with execution structures: altcoin liquidity is now fragmented across multiple exchanges, and decentralized protocols automatically liquidate overcollateralized altcoin positions when health indicators deteriorate.This tends to create self-reinforcing selling pressure when prices start to fall.Not to mention, market makers now mostly hedge their risk by shorting altcoins (altcoins have higher betas relative to large-cap cryptocurrencies, which allows them to keep their position sizes smaller).But due to the automatic deleveraging (ADL) mechanism, many market makers suddenly liquidated their positions and completely withdrew buy-side liquidity, exacerbating the sell-off.
Both events highlight an eternal market truth:When liquidity disappears and information asymmetry intensifies, the sectors with the highest beta coefficients and highest leverage ratios in any market will become pressure release valves, and forced selling will occur intensively.But what happens next?
recovery pattern
We think,The October 11 deleveraging sell-off was a necessary correction in the cryptocurrency market, not a cycle top, and could set the stage for a slow rise in the coming months.Before the events of October 11, our biggest concern was that the current bull cycle might end prematurely.In fact, a survey we conducted between September 17 and October 3 showed that 45% of institutional investors believe we are in the late stages of a bull market cycle.
After the sell-off on October 11th, we are even more convinced that the cryptocurrency market has upside potential, although we believe that the direction of cryptocurrencies in the coming months will depend more on the repair of market structure than major events.The 1011 liquidation wave exposed vulnerabilities in collateral standards, pricing mechanisms, and the stability of transfers between different trading venues.
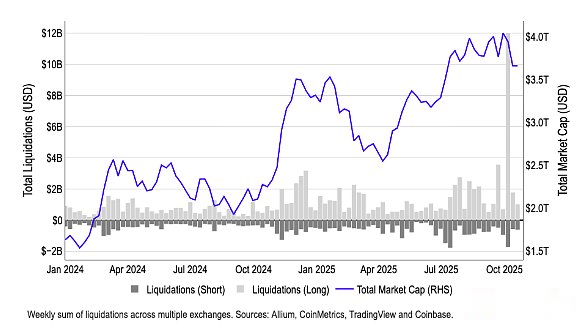
Figure 2. Sudden short-term shock to leverage reshapes cryptocurrency market landscape
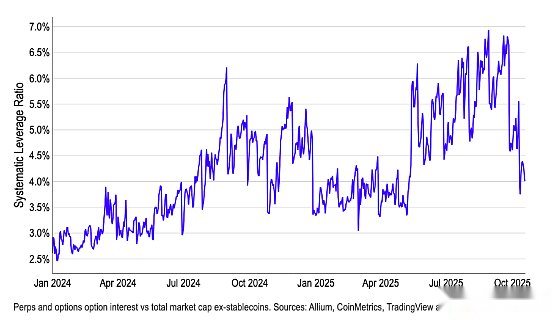
Leverage has largely returned to normal, however, and as can be seen from our systemic leverage ratio (based on total derivatives open interest divided by total cryptocurrency market capitalization excluding stablecoins), it is now roughly slightly above where it was at the beginning of the year (Chart 2).We believe this will be one of the key indicators to watch closely in the short to medium term.We believe that current leverage ratios indicate that the market may experience intermittent liquidity gaps and more pronounced tail moves until risk control mechanisms are coordinated and market maker depth fully returns to normal.
Looking ahead, we expect future market strength to be driven primarily by institutional inflows, as institutional investors are largely insulated from deleveraging events.Many institutions either maintain low leverage levels or focus primarily on larger market cap cryptocurrencies, while altcoins held by retail investors have borne the brunt of liquidations.We may see a rebound in the cryptocurrency market as institutional demand returns, but this may still be months away.
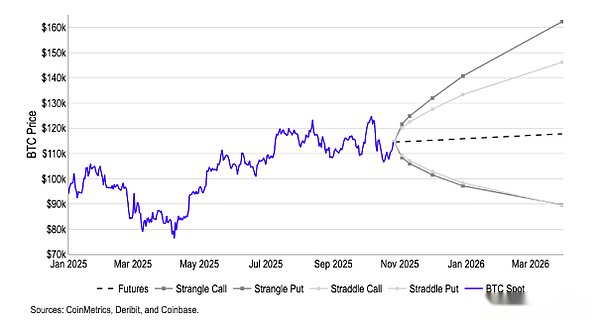
As such, we expect Bitcoin’s dominance to gradually increase over the next 2-3 months, which could put downward pressure on the ETH/BTC and altcoin/BTC trading pairs ahead of an eventual market rotation.It is worth noting that the break-even point based on the straddle and strangle option strategy,The implied market probability distribution of Bitcoin prices in the next 3-6 months is currently between $90,000 and $160,000, with asymmetric upward bias expectations.(Exhibit 3).
Chart 3. Implied distribution of Bitcoin price expectations based on breakeven points of straddle and straddle options
Follow the flow of funds
We believe that capital flows are the most direct indicator of market participants’ confidence following a market downturn.Following the recent deleveraging, we have seen excessive price increases while the market narrative has become muddled.To better understand positioning dynamics, we believe it is important to pay attention to the current direction of capital (re)allocation by “smart money” (including investment funds, market makers, venture capitalists and traders with consistent outperformance).
Tracking these flows can help us understand which ecosystems are regaining depth, incentives, and builder/user activity—that is, which areas are gathering near-term investment opportunities, and which protocols, decentralized exchanges (DEXs), and blockchains should be focused on.Having said that, this does not necessarily mean that market participants should purchase the native tokens of these platforms, as on-chain activity may reflect yield farming, liquidity provider (LP) allocation, basis/funding arbitrage, or airdrop strategies.Furthermore, it’s not always clear whether smart money’s bids are more strategic (driven by incentives) or more persistent.Therefore, we believe it is best to think of smart money flows as a tool for screening for specific investment opportunities.
After October 11, funds have shifted to Ethereum L1/L2 contracts (such as Ethereum and Arbitrum), while Solana and BNB have lost their upward momentum.Ethereum and Arbitrum lead the way in net inflows over the past seven days and have continued to grow over the past 30 days (Chart 4).At the same time, funds are being withdrawn from Solana and the BNB chain; outflows from the BNB chain have eased, but are still negative.
Figure 4. Smart money flows – by chain
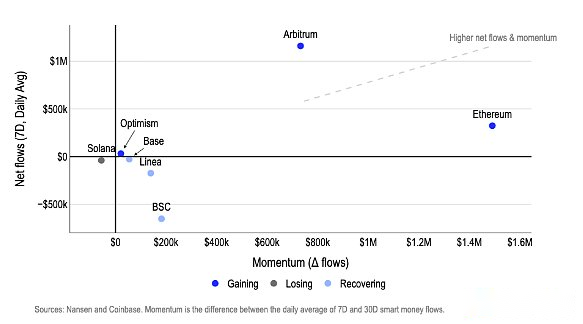
The catalysts for these flows vary.For example, Arbitrum relaunched incentives and DAO projects in October (e.g., DRIP Phase 4 will reward lending/liquidity for Aave, Morpho, and gaming-related activities), restarting the funding cycle while liquidity was redeployed.
We think it might be wise to keep a close eye on the tokens on the Base chain and look for potential turning point trading opportunities.From October 25th to 26th, activity on the Base chain surged, the x402 ecosystem showed parabolic growth, and Farcaster’s acquisition of the Clanker launch platform also promoted the issuance of new tokens and the influx of user traffic.This growth builds on early catalysts, including continued Base token speculation, the open-source Solana bridge, Zora’s listing on Robinhood, and Coinbase’s acquisition of Echo, which combined to expand app reach and add to the case for liquidity inflows.
At the same time, since October 11, the industry rotation trend has been more inclined to “practical + income” strategies rather than speculative strategies.As the market dislocation after the financial crisis reopened double-digit, point-plus annualized returns (e.g., fixed/floating income portfolios and funding rate arbitrage), income-based protocols led the natural flow of funds; while the NFT/Metaverse/game sector regained its vitality driven by strategy-driven mechanisms (such as PunkStrategy’s deflationary NFT trading cycle) and blockbuster transactions (such as Coinbase’s acquisition of UPONLY).
Chart 5. Smart money flows – by track
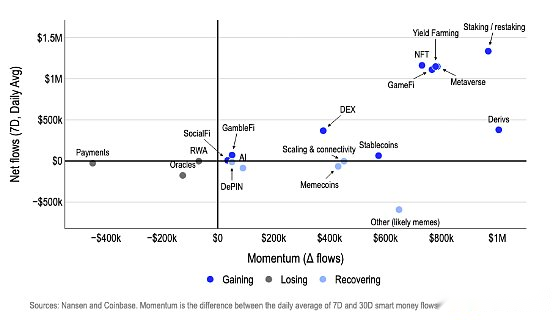
The staking/re-staking theme remains strong as Grayscale launches the first ETH and SOL staking ETP in the United States and institutional investors flood the market.In short, savvy investors are flocking to areas with clearer paths to returns, more reliable incentives, and closer ties to institutional investors, and are using stablecoins to selectively redeploy risk (Exhibit 5).
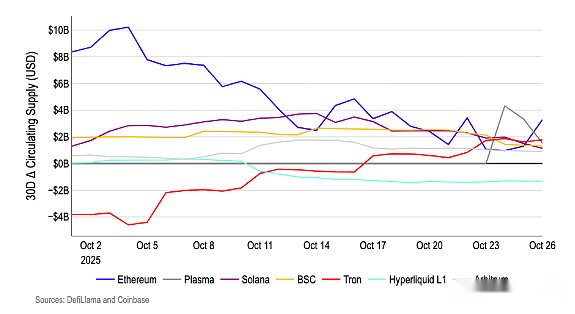
Stablecoin flows also suggest that we are seeing a rotation of funds rather than a massive influx of new money.Over the past month, most major blockchains have seen a decline in their past 30-day stablecoin growth rates, with the exception of Tron (Chart 6).We believe this means that post-crash flows were redistributive rather than incremental—liquidity was selectively shifted between protocols with active catalysts, but the system did not see a general surge in stablecoin supply.Actually,This means that the rally will likely still rely on strategic incentives and narrative-driven funding rotations until there is a more significant increase in the circulating supply of stablecoins that can truly drive most tokens higher.
Chart 6. Stablecoin supply momentum – by chain
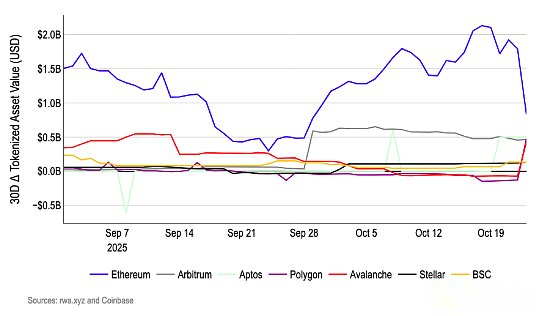
The tokenized asset track is a key area of concern for institutional investors.In October, BUIDL, a subsidiary of BlackRock, injected approximately US$500 million into Polygon, Avalanche and Aptos (Chart 7).The capital injection, totaling approximately $1.5 billion, highlights the resilience of real-world assets (RWA), allowing it to remain attractive to traditional financial institutions during times of market volatility, as it provides stable yields (tokenized Treasury yields are 4-6%) and liquidity, avoiding the speculative bubble that was cleared in the October 101 crash.
These deployments are no longer limited to Ethereum (BUIDL’s original platform), but take full advantage of each chain – Polygon offers Ethereum-compatible scalability and low fees, Avalanche offers a high-throughput quantum network ideal for institutional DeFi integration, and Aptos offers Move language security for handling complex assets.While this may seem like a selective expansion by a single player (BlackRock), we believe that BlackRock’s commitment to expanding access to RWA amid heightened uncertainty in the cryptocurrency space highlights the significant potential of the RWA space as a future growth point.
Figure 7. Real-world asset flows – by chain
Don’t forget the macro environment
Finally, it is important not to forget that cryptocurrencies still trade in a highly complex and increasingly risky macro environment.The sell-off eliminated the excessive leverage common in late bull markets.However, a number of macro factors are adding to the uncertainty in investor sentiment: trade tensions (e.g. tariffs), geopolitical conflicts (e.g. U.S. sanctions on Russian oil producers), soaring fiscal deficits (both in the U.S. and elsewhere), and overvaluation of other asset classes.
Despite the Fed’s easing policy, the 10-year U.S. Treasury yield remains stable around 4.0%, with fluctuations between 3.5% and 4.5%.This stability partly explains why we are not too concerned about the steepening trend at the edge of the yield curve (which typically flattens during periods of prolonged easing).However, we believe the steepening trend in the yield curve is likely to continue, and riskier asset classes such as U.S. stocks and cryptocurrencies may be at risk of a downside correction if yields spike.This could happen, for example, if fiscal buffers are weakened.
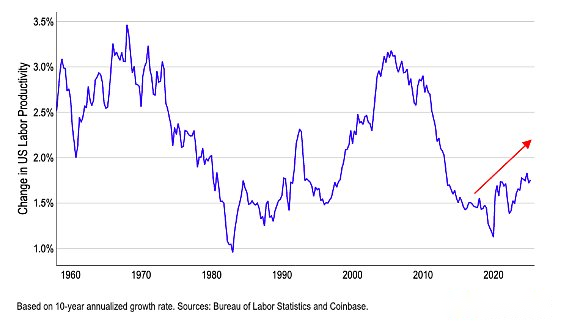
On the other hand, if long-term yields do move higher as the U.S. economy grows, that would reflect more of strengthening economic fundamentals than policy considerations.Faster nominal growth and productivity gains can sustain higher discount rates and provide good support for risk assets, including cryptocurrencies.As such, we believe economists are currently generally underestimating productivity, in part because factors such as artificial intelligence are making the workforce faster and more efficient, and official statistics don’t fully reflect this.
Exhibit 8. U.S. labor productivity growth (10-year annualized rate)
If true, it would suggest that the impact of macroeconomic fluctuations on risky assets through the discount rate channel may be weakening.This will redirect the drivers of cryptocurrencies towards endogenous factors such as liquidity, fundamentals, positioning, and regulatory developments that favor cryptocurrencies (such as the U.S. Cryptocurrency Market Structure Act).
Conclusion
Overall, the current cycle stage of the cryptocurrency market remains a subject of intense debate, but we believe thatThe deleveraging and bubble squeeze of a few weeks ago set the stage for steady gains in the coming months.We believe that macro-positive factors such as the Federal Reserve’s interest rate cuts, easing liquidity, and crypto-friendly regulatory initiatives such as the GENIUS Act/CLARITY Act still support the bullish market and are likely to extend the cycle into 2026.
Nonetheless, capital flows after October 11 were more akin to a selective return to risk rather than a renewed influx into risky areas.These funds have moved towards EVM technology stacks (such as Ethereum and Arbitrum) and the “utility + yield” space, while capital flows have cooled on Solana and BNB chains, and the growth rate of stablecoins has slowed.This suggests that funds are being reallocated to specific verticals rather than a systemic infusion of funds.
At the same time, the inflow of large amounts of RWA funds shows that institutional investors intend to expand on-chain business, but they will adopt a cautious and diversified approach.Indeed, we believe the short-term rally will continue to be concentrated at the intersection of incentives, product launches, and institutional support, although more sustainable cryptocurrency price action will likely require a return to overall liquidity first.
While cryptocurrency market sentiment remains in a “panic” mode, we believe that the recent deleveraging is actually a precursor to mid- to long-term strength, setting the stage for further gains in the first quarter of 2026.


