
Author: Michael Nadeau, DeFi Report; Compiled by: Bitchain Vision
Tom Lee just presented one at Korea Blockchain Week$60,000 ETH “mid-term” target, and hints that Ethereum is in a 10-15 year super cycle.
If he’s right, this will unfold in waves.Across multiple cycles.With bull and bear markets.
at present,We are in a bull market.but it won’t last forever.
Given that ETH fell 94% in 2018 and 80% in 2022, we should expect another sharp decline.We don’t know when this will happen.
But we do know where ETH has reached over the past cycle relative to several important technical indicators we track.
This week, we share our analysis designed to help you anchor potential outcomes and plan accordingly.
Disclaimer: The views expressed are those of the author and should not be relied upon as investment advice.
Let’s get started.
Key Technical Indicator Analysis and Price Targets
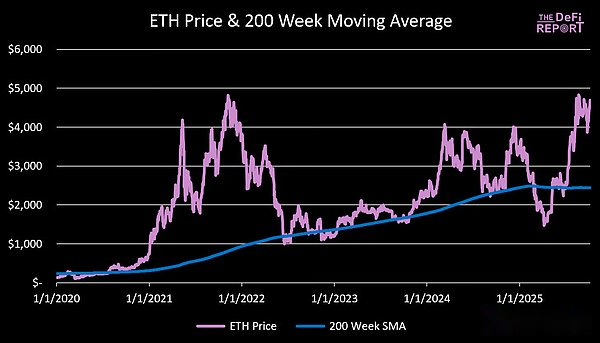
200-week moving average
Data source: The DeFi Report
ETH is currently trading 92% above its 200-week moving average of $2,400.
During the 21-year cycle, the market peaked when ETH was trading 492% above its 200-week moving average.
Scenario analysis:
· 200% above the 200-week moving average:$7300
· 250% above the 200-week moving average:$8500
· 300% above the 200-week moving average:$9800
· 350% above the 200-week moving average:$11,000
· 400% above the 200-week moving average:$12,200
The 200-week moving average is a moving target; however, over time we are replacing ETH prices from approximately 4 years ago (when prices were in the $3-4k range).Therefore, we expect the 200-week moving average to see only minimal movement by the end of the year.
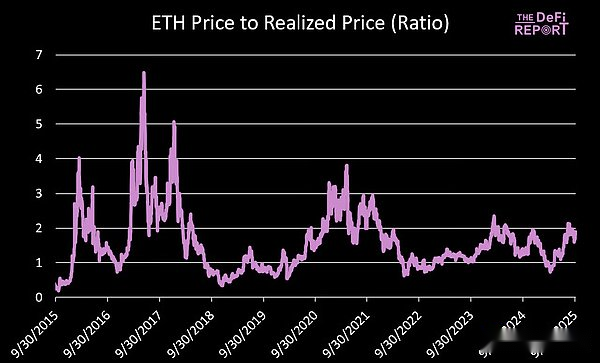
Ratio of ETH price to realized price
Data source: The DeFi Report, Glassnode
Since January 1, 2017, the ratio of ETH price to realized price (a proxy for cost basis) has averaged 1.6.
The current ratio is 1.9.
In the 17-year cycle, the ratio peaked at 5.
Last cycle, it peaked at 3.5 (top in April) and 2.9 (top in November).
Scenario analysis (assuming we reach a ratio of 2.9):
· Realized price $3,000 = ETH $8,700
· Realized price $3.5k = ETH $10,200
· Realized price $4,000 = ETH $11,600
From January 1, 2023, the ratio needs to increase by 1, which has happened twice in the past 3-6 months.
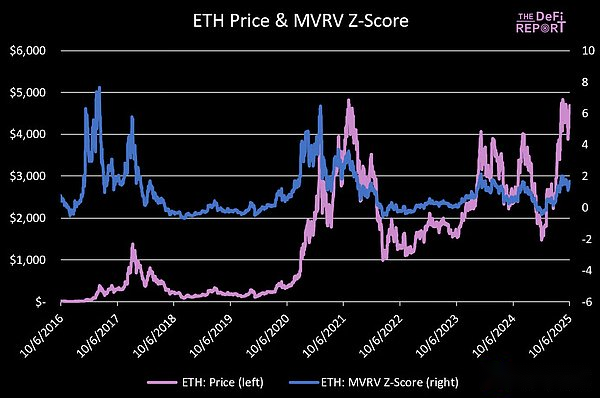
MVRV Z-Score
Data source: The DeFi Report, Glassnode
The Z-Score tells us how many “fluctuation units” the market capitalization is above or below the on-chain cost basis.High values indicate statistically overheating conditions.A negative value indicates an underestimation.
As of January 1, 2017, the average Z-Score for ETH is 0.99 – indicating a bias towards optimism (market value is higher than realized value).
The current value is 1.66 (above historical average, but not excessively “hot”).
In the last cycle, it peaked at 6.5 (top in April) and 3.48 (top in November).
Scenario analysis:
· Z-Score is 2.21: ETH$7000
· Z-Score is 2.77: ETH$8,000
· Z-Score is 3.33: ETH$9,000
· Z-Score is 3.9: ETH$10,000
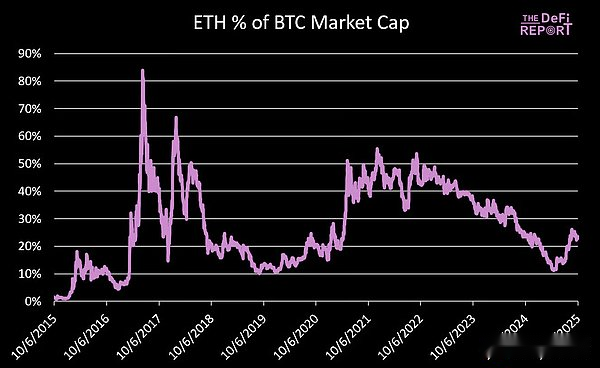
ETH vs BTC
Data source: The DeFi Report
The market value of ETH corresponding to the current trading price of ETH accounts for 23.4% of the market value of BTC.
In November 2021, the market value of ETH reached a peak of 55.5% of the market value of BTC.
If BTC reaches $150,000 (up 23% from current levels), this will bring the BTC market cap to $3 trillion.
Scenario analysis:
·Accounting for 35% of BTC market value:$1.05 trillion, or $8,658 in ETH
·Accounting for 45% of BTC market value:$1.35 trillion, or $11,132 in ETH
·Accounting for 55% of BTC market value:$1.64 trillion, or $13,559 in ETH
The key question is whether we will see a significant rise in BTC, and whether ETH’s movement relative to BTC will be moderate or explosive compared to the previous cycle.
ETH vs Nasdaq
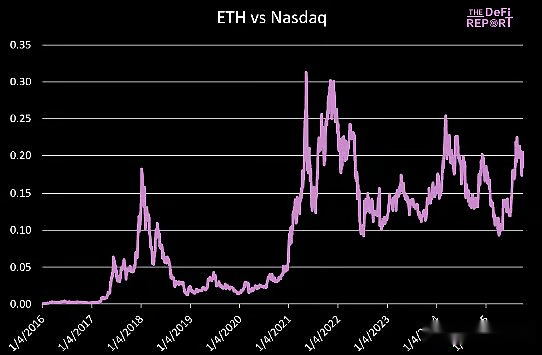
Data source: The DeFi Report
The ETH/NASDAQ ratio peaked at 0.31 in May 21 and 0.30 in November 21.
The current ratio is 0.20 and the Nasdaq is trading at 22,788 points.
If it gains 5% by the end of the year (up 23% for the year), that would take the Nasdaq to 23,927.
ETH scenario analysis:
· 0.25 Ratio =$5,981
· 0.30 Ratio =$7,178
· 0.35 Ratio =$8,374
· 0.40 Ratio =$9,570
Our fundamental rationale is that the upward trend in the ETH/NASDAQ ratio will continue with the new cycle and we will establish a new high (above 0.30) this cycle.
Conclusion
We predict,
Basic situation:
· ETH is trading 250% above its 200-week moving average ($8,500)
· Realized price reaches $3,000 (ETH $8,700, assuming ratio of 2.9)
· ETH reaches 35% of BTC’s market capitalization.At $150,000 in BTC, this brings ETH to $8,600.
· ETH establishes new highs against the Nasdaq.0.35 ratio = ETH $8,300.
Bullish scenario: Will take ETH above $10,000.The bearish scenario is that BTC’s peak trend spreads to ETH, resulting in a mild peak.
At the same time, as market sentiment heats up, we are seeing more and more comments about “cycle extension” emerging in the market.
This reminds me of the “supercycle” narrative that became popular during the same phase of the 21-year cycle.
As we said before, our base case remains to be peaking this quarter.


