
Monday’s liquidation incident resulted in the closing of more than US$1 billion of leveraged long positions, and derivatives and macro indicators became the key to determining the future trend.
Spot prices hovered around $112,965 during the day, down about 10% from their recent highs.The market is digesting the impact of the Federal Reserve’s decision to cut interest rates last week and the rebound in volatility.
This round of adjustments began in the futures market, and forced liquidation caused the long positions of major trading platforms to significantly reduce.During the period, more than US$1.6 billion of long positions were liquidated, and the open contracts fell from the cyclical high, causing the nominal position base of Binance, Bybit and CME platforms to remain considerable in scale.
The Coinglass dashboard shows that BTC futures open contracts continue to decrease, the capital rates of major perpetual contracts converge to a neutral level, and a distribution trend of gathering around spot prices appears on the liquidation heat chart.
Options market reprices shocks
Deribit analysis platform and Laevitas’ 25Delta skewness data show that short-term put options trading prices are higher than call options. This structure reflects downward protection demand and also indicates that market makers maintain negative Gamma positions near spot.
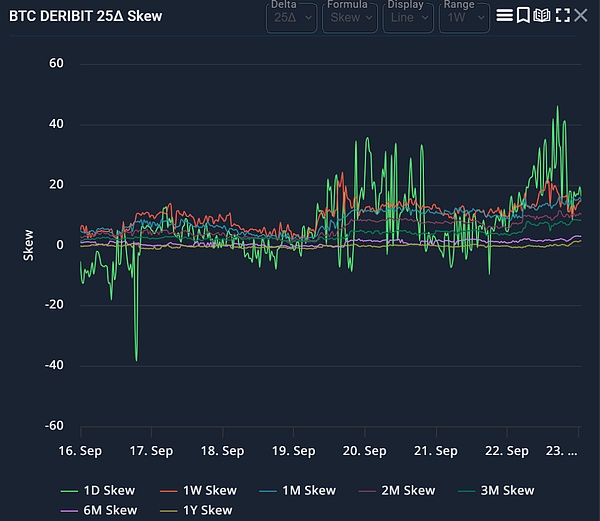
When the spot price is in the negative Gamma range, this configuration usually expands the intraday fluctuation range, and the fluctuation will flatten after the price stabilizes, Gamma turns positive.
Capital flows are not one-way.Farside Investors data shows that the U.S. spot ETF portfolio saw a rare September net outflow on Wednesday, September 17, with a scale of about $51 million.Among them, IBIT absorbed about US$150 million, while FBTC and GBTC were redeemed.
Funds were flowing back Thursday and Friday, with a total of $385 million inflows before the weekend.Such differentiated data may suppress short-term momentum, but if capital inflows are restored overall, medium-term buying support will still exist.
The basis and term structure become the health indicators for the fourth quarter.CryptoQuant’s CME annualized basis sequenceList(Indicators used to measure arbitrage demand for arbitrage capital) From 9The high will fall in the middle of the month, and it is necessary to continue to observe whether it will maintain a 10%+ low position, which will mean that the position structure is healthier.
If the basis rebounds rapidly to a high of more than 15%, it means that the leverage is re-accumulating during the rebound.
Macroeconomic factors still have marginal influence.After the Fed cut interest rates by 25 basis points, the U.S. 10-year Treasury yield hovered at a 4% low, and the U.S. dollar index strengthened in the new week.
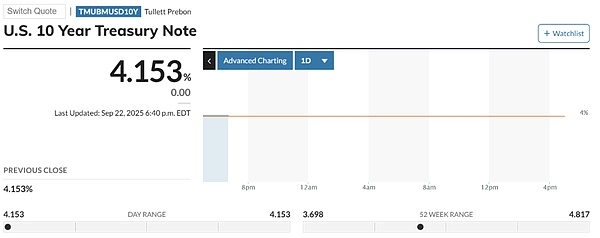
If this trend continues, it may suppress the performance of the crypto market Beta.According to the MarketWatch 10-year Treasury bond page, the 10-year yield remained near 4.1%, and the US dollar index strengthened simultaneously with cautious stock index futures.
These data can pose tactical resistance to rapid upward action, but when crypto markets are driven by positions, their impact is often intermittent.
Based on these factors, the path analysis at the beginning of the fourth quarter can be summarized into two competitive ranges corresponding to obvious liquidation ranges and market maker positions:
Scenario A: rebound and squeeze
Pushing spot prices to the $118,000-124,000 range, which overlaps with the common Gamma friction points at the clearing cluster and integer mark above the Coinglass thermal map.
The trigger conditions include: rising daily capital rates remain stable at zero or negative values, moderate reconstruction of direct short positions, neutral drifting of skewness, and stable net inflows for ETFs for many consecutive days.
These conditions will convert the remaining open contracts into upward momentum and enter range oscillation after Gamma becomes protective.
Scenario B: Secondary down
Prices fell to the range of $104,000-108,000, and the liquidation density in this region was lower than the recent low, with risks of continued negative skewness, weak ETF capital flows, and both the 10-year U.S. Treasury yield and the US dollar index strengthened.
Under this path, the decline of major platforms will turn from neutral to negative on the daily basis, and the implied volatility will remain high (as market makers maintain negative Gamma below $115,000). This combination will continue to be downward path-dependent until the open contracts are further reduced or option inventory reverses intraday volatility.
The position size of the regulated platform can be used as an effective cross-verification
The CME Bitcoin Futures page displays deep liquidity and continuous participation, providing institutional activity reference for the end of the September options futures quarterly extension.
The decline in CME basis is accompanied by stable open positions, indicating normalization of positions rather than full deleveraging; if the open positions drop significantly, a larger range reset is confirmed.
Seasonal factors affect the benchmark probability.Coinglass monthly returns show that most of the positive median returns in October history, which traders dubbed “up October”.
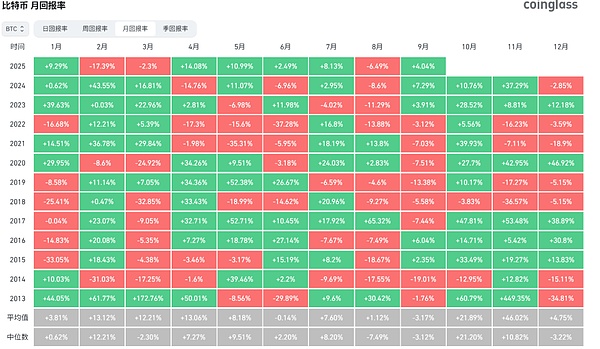
Seasonality itself does not drive the market, but if combined with a healthier derivative structure, it can increase the probability of recovery path after a sharp fluctuation in September.
The key at the moment is whether the leverage is sufficiently neutralized to prevent spot from excessive reflective fluctuations.Coinglass data shows that even after weekend liquidation, open contracts are still higher than the average for the year, and the capital fee rate has eased but has not collapsed. The heat map shows that there are operational clusters in the range of 5%-8% of the spot.
Farside’s ETF ledger is still showing differentiation rather than one-way flow, the CryptoQuant basis sequence is in the observation range, and the Laevitas and Deribit skewness reports still show that put options are dominant. If the price gradually rises and the shorts are forced to chase the rise, the configuration may reverse quickly.
The near-term market will depend on position signals: if the capital rate remains stable at zero axis, the net inflow of ETFs for many consecutive days, and the normalization of skewness pushes the negative Gamma range upward, then squeeze to $124,000 will become the dominant path.
If the U.S. Treasury yield remains strong with the US dollar, the skewness remains negative and the ETF capital flows sway, the pressure to fall by $108,000 will accumulate.Traders who are keeping a close eye on the same dashboard will quickly identify the actual path.


