Source: Glassnode; Compilation: Deng Tong, Bitchain Vision
summary
-
Bitcoin has reached a local high of $107,000, which is close to its all-time high of $109,000 set in December 2024.This has driven a significant increase in capital inflows, bringing its actual market value to a record high of $900 billion for the first time.
-
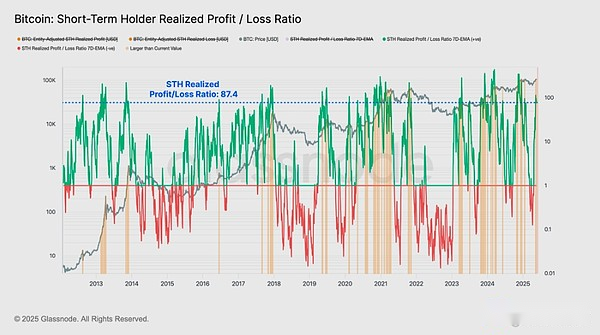
With one of the most significant improvements in short-term holders’ profitability ever, the group’s spending activity has surged, with a peak daily real profit of $747 million and a cumulative profit of $11.4 billion in the past 30 days.
-
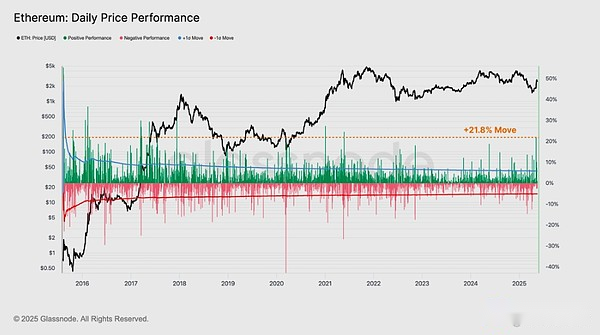
Ethereum’s price has experienced a sharp rise in recent weeks, which may be driven by the successful upgrade of Pectra on May 7.Recent rebounds include multiple single-day price increases of more than +1σ, with the most notable being the +21.8% surge, the strongest single-day gain since May 2021.
-
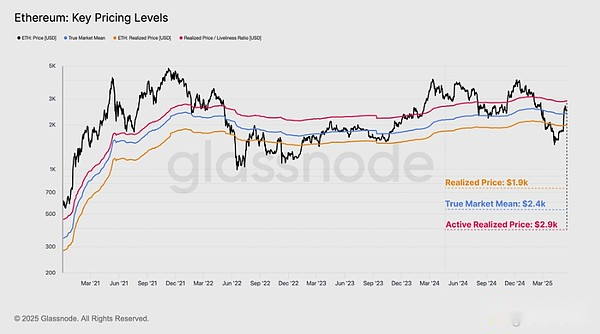
It is worth noting that the $2,400-2,900 range remains a key area for Ethereum, both a resistance zone and a potential breakthrough level necessary to maintain the upward momentum.
Strong trend
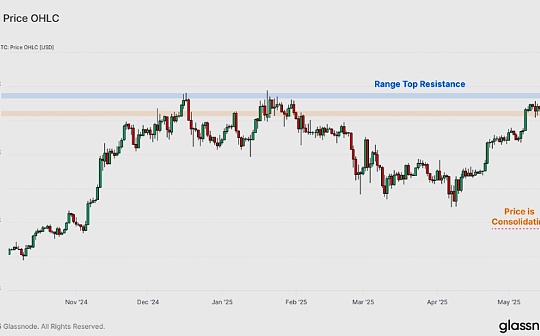
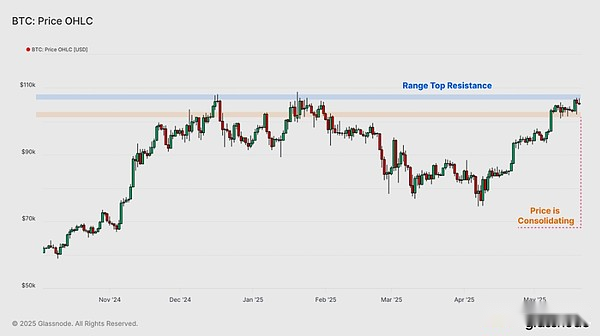
In recent weeks, the digital asset ecosystem has continued to strengthen, with Bitcoin leading the rise, once hitting a local high of $107,000, and is currently only one step away from the all-time high of $109,000.The market has encountered significant resistance between $102,000 and $105,000 and has been in a consolidation state over the past two weeks.
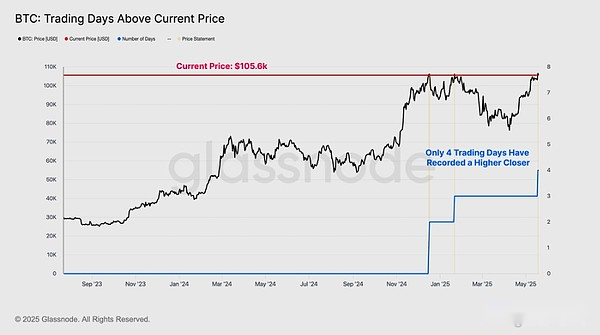
So far, Bitcoin’s single-day closing price in only four trading days has been higher than that price, with a closing price of $106,500 last week, a record high.Bitcoin trading prices have also risen by about 40% over the past six weeks, highlighting the strong momentum of the market recovery.
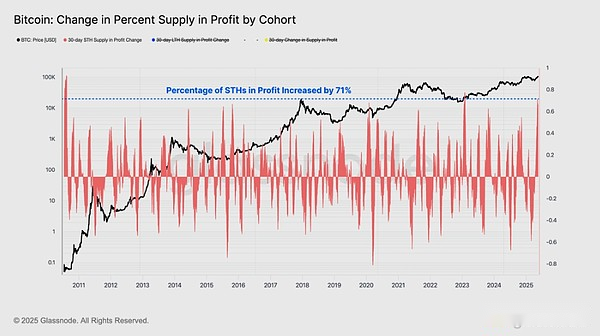
As the market quickly recovers from the decline, we can track the changes in the proportion of profit supply held by different groups over 30 days.This helps us identify which investor groups benefit during the recovery period and reflect a significant shift in market sentiment.
Recent price increases have particularly brought significant financial relief to the short-term holder population, with their profit supply increasing by +71% over the past month.This is the second most positive growth in profitability in this group ever.
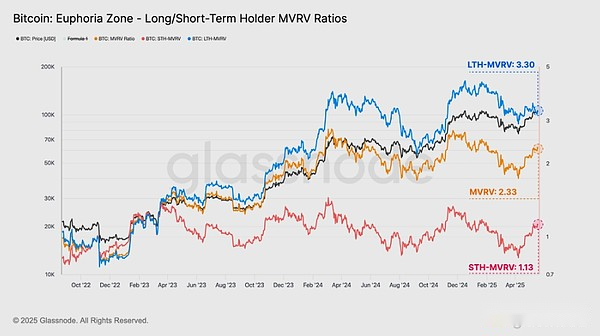
Another tool we can use to measure the improvement of investor profitability is to examine changes in MVRV ratios per group since the local low of $74,000.
-
MVRV rose from 1.74 to 2.33 (unrealized earnings rose from +74% to +133%).
-
STH MVRV rose from 0.82 to 1.13 (unrealized losses rose from -18% to +13% unrealized benefits).
-
LTH MVRV rose from 2.91 to 3.30 (unrealized earnings rose from +191% to +230%).
It is worth noting that the financial status of investors in all of these groups has been significantly improved.This may have a ripple effect, boosting investor confidence and sentiment.
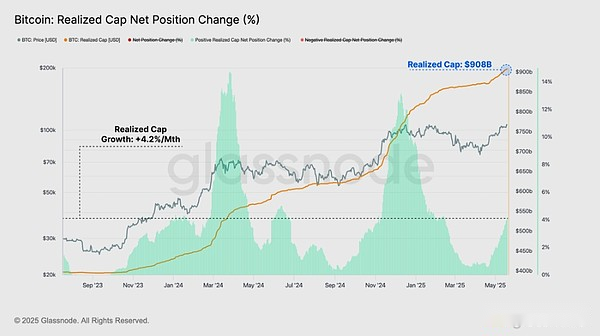
As market conditions improve and investors’ portfolios recover, many are seizing opportunities to lock in profits.Profit-taking in a bull market can be considered the opposite of new demand, which is absorbing supply.
One way to quantify changes in supply and demand balance is through the “Achieved Market Value” indicator, which summarizes the cumulative net capital inflows into digital assets.The total value of the Bitcoin network has increased by 4.2% over the past month, reflecting a significant increase in capital entering the market.
This has set a new high for “realized market value”,It exceeded $900 billion for the first time, an important milestone highlighting the huge value investors have hidden in this leading digital asset.
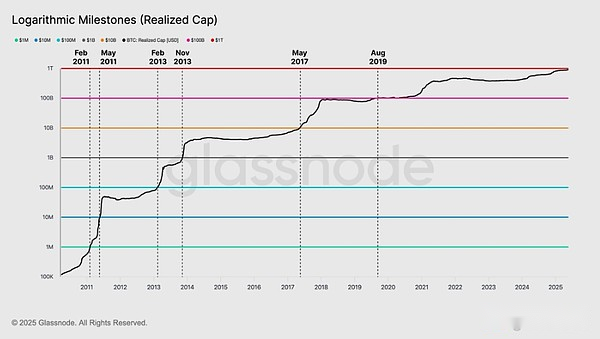
With the realization of a milestone of about to break the $1 trillion market capitalization, we can track the trajectory of capital flows over the 16-year history of the Bitcoin network.The following figure shows the time interval between achieving market value breakthroughs across each logarithmic milestone:
-
$1 million: February 2011
-
$10 million: May 2011
-
$100 million: February 2013
-
$1 billion: November 2013
-
$10 billion: May 2017
-
$100 billion: August 2019
Between 2011 and 2013, the actual market value increased from $1 million to more than $1 billion, crossing four logarithmic milestones in two years.The scale of Bitcoin at that time was much smaller than that now, and it experienced exponential growth during the initial boot stage of the network.The next important milestone—$10 billion—was achieved before the actual market value reached $10 billion in mid-2017.
The last logarithmic milestone—$100 billion—was reached nearly six years ago, in August 2019.This is the longest interval between logarithmic milestones, indicating that the asset’s appreciation and growth slowed over time, taking longer, and increasing capital to break through the $1 trillion threshold.
Short-term holders make profits
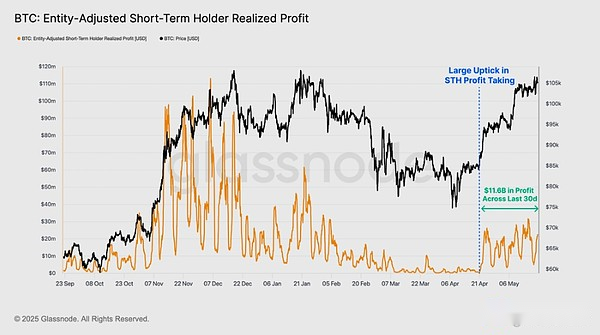
After the biggest ever increase in short-term holder profitability, many investors who buy on dips in recent times may turn to profit-taking to capitalize on market strength.
As prices accelerate to the short-term holder cost price of $93,000 and eventually breaking that level, we can see a significant increase in profit-taking activity, peaking at $747 million a day.
Over the past 30 days, we have seen short-term holders achieve a cumulative profit of $11.4 billion.By comparison, they have achieved only $1.2 billion in profits over the past 30 days, highlighting a strong rebound in new investor sentiment and spending behavior.
This shift has led to a sharp surge in profit-loss ratio for short-term holders.The realized profits of short-term holders far exceed the realized loss, so only 8% of the trading day profit-loss ratio reaches a relatively high level.
Historically, such highs are common in strong bullish momentum, but often occur when the market rebounds to local and global top patterns.Excessive profit-taking may overwhelm the inflow of new demand, causing resistance to excess supply.
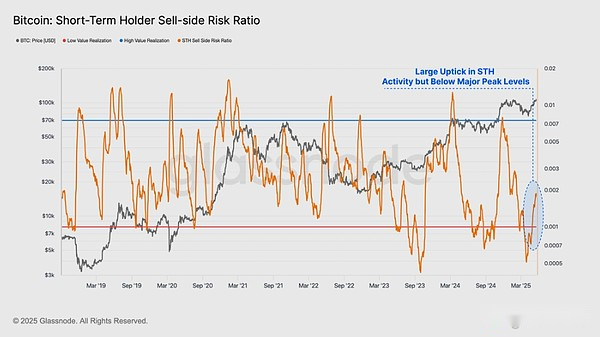
We can complement this analysis by leveraging seller risk ratios, a powerful tool that can assess the level of “equilibrium” of the market from the perspective of existing holders.We can consider this indicator under the following framework:
-
A high value indicates that the profit or loss of investor spending tokens is larger than its cost basis.This situation suggests that the market may need to re-find a balance and usually occurs after large price fluctuations.
-
The low value indicates that the spending price of most tokens is relatively close to their break-even cost basis, indicating that a certain level of balance has been reached.This situation usually indicates that the “profit and loss” in the current price range has been exhausted, and usually describes a low volatility environment.
For the short-term holder population, we can see their seller risk ratios rising dramatically, although this ratio is still well below the usual levels near the major peaks.This suggests that the market may still have room for continued upside, as investors have not locked in excessive profits relative to their total holdings.
Ethereum soars due to Pectra upgrade
Ethereum is the world’s second largest digital asset, and the market environment has been challenging in recent years.ETH prices have failed to meet investor expectations since 2023 and have so far not hit a new high in this cycle.
However, ETH prices have experienced a sharp rise in recent weeks, possibly due to the excitement caused by the successful upgrade of Pectra on May 7.The Pectra upgrade is designed to consolidate the validator population and improve overall network efficiency.
Ethereum prices have risen from $1,800 to a local high of $2,700, up 50% in a few weeks, bringing significant financial relief to investors.
In the recent upward trend, the ETH price has increased by more than +1σ in a single-day manner many times, with the most significant increase of as high as +21.8%, setting the strongest single-day increase since May 2021.
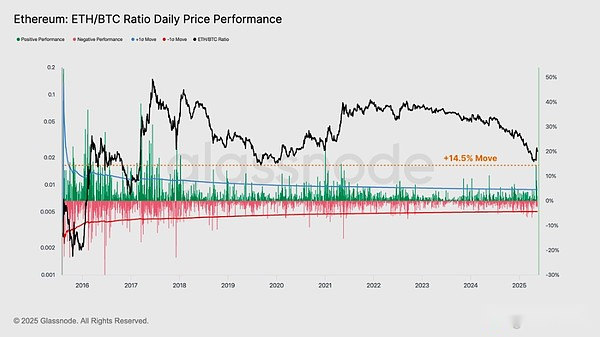
In this cycle, the difference in the performance of the two leading digital assets is reflected in the ETH/BTC ratio.The ratio has been on a continuous downward trend since the 2022 merger event.Recently, the ratio has fallen to 0.018, the lowest level since January 2020.
Ethereum’s outstanding recent performance has led to a rebound in the ETH/BTC ratio, accelerating to 0.026, an increase of 14.5%, the 46th increase on record.
It is worth noting that this price rebound has decisively broken through the current realized price of $1,900.This suggests that the average holders of ETH have now returned to unrealized profits, bringing significant economic relief to many holders.
Active realized prices and real market mean are two alternative on-chain valuation models that trade prices usually approach the midpoint of the Ethereum market cycle.These metrics estimate the cost basis for active market participants and deduct lost tokens and long-term idle supply.This provides a more accurate understanding of the cost basis of economically active investors.
-
Real market average price: USD 2,400
-
Actual transaction price: USD 2,900
Encouragingly, prices have also broken through the real market average, highlighting the strong momentum of this price increase.However, active realization prices are still above and are still a key level, and a decisive rebound must be supported to support the continued increase in Ethereum investor confidence.
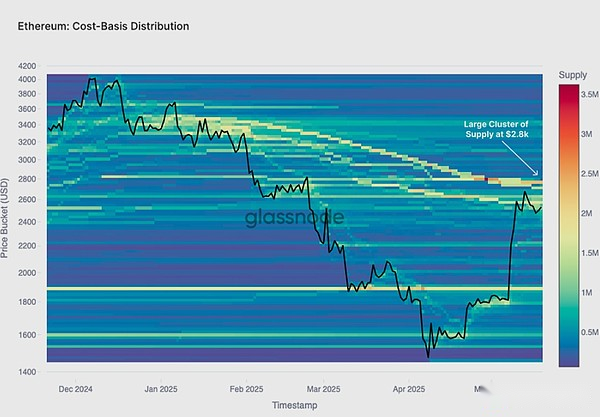
When examining the basic distribution of Ethereum’s cost, we can find some commonalities.Currently, the basic level of the cost of investors is mainly concentrated around $2,800.The region may increase seller pressure, as many previously underfunded investors may seek to reduce risks and profit from breakeven when they are or near breakeven.
in conclusion
The digital asset market remains strong, with Bitcoin continuing to consolidate near its all-time high of $109,000.Rising prices have boosted the profitability of most market investors, and many seized the opportunity to lock in profits.As a result, capital inflows have increased significantly, driving the market value to exceed US$900 billion for the first time, which is a historic milestone that highlights the depth of market liquidity.
For short-term holders, the increase in their portfolio value directly translates into a significant increase in spending activity, which has achieved more than $11.4 billion in profits over the past month.
Ethereum showed a strong market reaction after the Pectra upgrade, with its spot price rising from $1,800 to a high of $2,700.The rebound has regained unrealized profits for ordinary ETH holders, bringing them significant financial relief.It is worth noting that the $2,400-2,900 range remains a key area of concern, both a resistance band and a potential breakthrough area for maintaining further upward momentum.