Author: Michael Nadeau, The DeFi Report; Translation: Bitchain Vision xiaozou
With Bitcoin rising 45% last month, I see a lot of people talking about whether this is a “partial top” or will “sprint all the way” to the end of the year.These are mainly instinctive calls on social media by “key opinion leaders” and other market prophets and analysts.Of course, no one has predicted the future of crystal balls.But to build a firm belief, we like to combine our intuition, experience and analysis with conclusive data.This helps us assign probabilities as accurately as possible for possible outcomes.
This is the characteristic of The DeFi Report, and our research usually includes:
Macroeconomic analysis
On-chain data analysis
Market sentiment analysis
Basic analysis of blockchain and protocols
Cryptocurrency native/characteristic analysis (such as politics, geopolitics, regulation, community and other unique aspects of cryptocurrency as global assets)
In this report article, we will focus on the data on the Bitcoin chain and attach additional SPX6900-related content at the end of the article.
Our goal is to determine where we are in this cycle.To do this, we analyze the current key indicators of Bitcoin and compare these indicators with past cycles.
1. Long-term holders and short-term holders
(1) Long-term holders
Let’s first look at Bitcoin’s “Smart Money”.
What is Smart Money doing now?For sale.
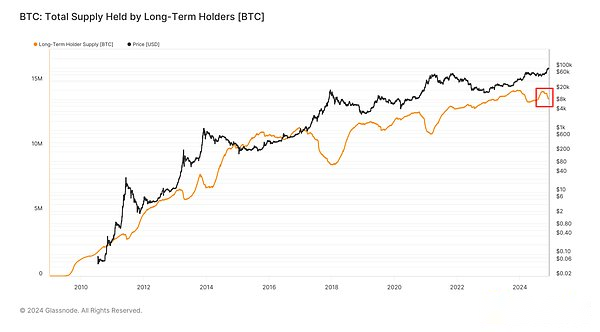
Long-term holders make profits in the first quarter of this year, re-accumulating wealth in the summer and starting to make profits again after the U.S. election.This is not surprising.After all, Bitcoin rose 45% last month.It rose 600% compared to the cyclical lows.
Currently, 69% of Bitcoin circulation supply is in the hands of long-term holdings.As the bull market continues, we expect to see long-term holders transfer their tokens to short-term holders.So the 69% ratio should continue to decline.
Data summary:
In the 2021 cycle, Bitcoin price peaks when 58% of the circulating supply is held by long-term holders.
During the 2017 cycle, Bitcoin price peaked when 51% of the circulating supply was held by long-term holders.
Conclusion: Smart money starts to make a profit.We believe this will continue as new funds enter the market.To make prices rise, demand (new funds) must exceed supply.We think this will happen.
(2) Short-term holders
Turn to Bitcoin’s “New Money”.
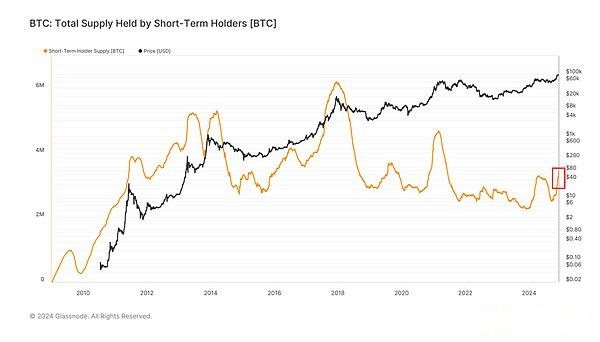
Short-term holders are new market entrants.In a bull market, we usually see this group on an upward trend, while the number of long-term holders will decline.This is exactly what we see today.
Short-term investors chased the market again in the first quarter.Many short-term players quit this summer’s big reshuffle.Now we see a new momentum.
Data summary:
Currently, 16.6% of the Bitcoin supply is in the hands of short-term holders.
During the 2021 cycle, BTC peaked with short-term holders holding 25% of the circulating supply.
In 2017, BTC reached its price peak when short-term holders controlled 70% of the supply.
Conclusion: New funds are flowing into Bitcoin.Judging from the past cycle, there may be more new capital inflows in the future.
2. Exchange
(1) Exchange balance
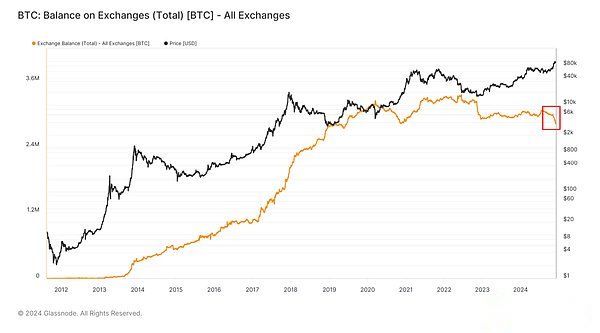
Currently, the exchange’s balance is declining.This is an anomaly to some extent, because as the price rises, what we should see is the token entering the exchange.Instead, we see Bitcoin leaving the exchange, presumably in a self-custodial form.
It is worth noting that this is not the first time we have seen this.At the beginning of the price increase in early 2021, the yellow and black lines deviated in a similar pattern.Later in the cycle, funds eventually return to the exchange.
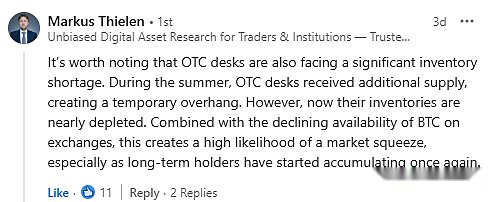
In addition to the exchange’s Bitcoin balance being at its lowest level since 2019, I also heard that the OTC trading counter is short of Bitcoin.Here is a comment from Marcus Theilen, founder of 10x Research, on a recent post on LinkedIn:
Conclusion: Bullish
(2) Financing rate
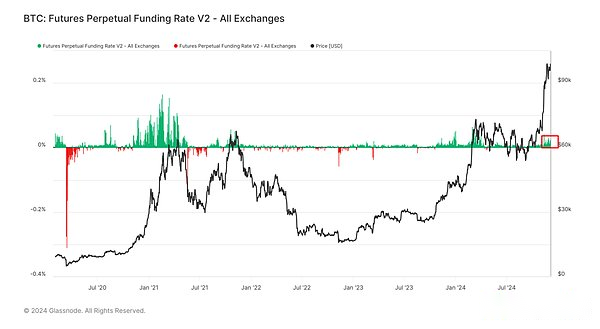
Financing rates in the futures market can help us understand traders’ sentiment and development momentum.A green line means that longs will pay shorts to keep their positions.The red line means that the shorts are paying the longs.
Data summary:
Currently, Bitcoin’s financing rate is 0.012%, and when the price of Bitcoin reaches $100,000, the financing rate was as high as 0.025%.
In March this year, the financing rate was as high as 0.07%.
During the 2021 cycle, the financing rate reached a peak of 0.17%.
Conclusion: Historically, the financing rate is quite low today—because Bitcoin is trading close to $100,000.High financing rate indicates that leverage is too high and is a “House of Cards”-style market structure.This is not what we are seeing today.So, bullish.
3. Ratio of market value to realized value (MVRV)
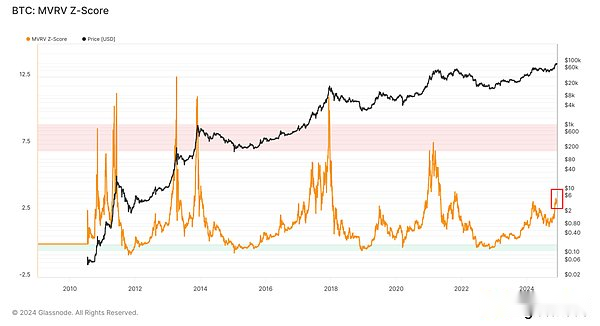
MVRV Z-Score helps us understand the relationship between Bitcoin’s current market value and “realized value”, which is the basic tool for network costs.It basically gives us an idea of the average unrealized gains for Bitcoin holders.It has always done a great job of identifying cycle peaks.
Data summary:
The current MVRV is 3.17.This means that an average holder has 217% unrealized gains.
The MVRV at the peak of the cycle in 2021 is 7.5 (return is 650%).
The MVRV at the peak of Bitcoin in 2017 was 11 (return 1000%).
Let’s go deeper and focus on the long-term holder group:
The current long-term MVRV is 3.89.
The MVRV in March was 3.76.
Long-term MVRV holdings reached 12 when BTC prices reached their peak in the last cycle.
The index was 35 at its 2017 cycle peak.
The MVRV for short-term holders is currently 1.26, indicating that the average rate of return for short-term holders is 26%.
Data summary:
The MVRV in March was 1.45.
It reached a peak of 1.8 in the 2021 cycle.
The MVRV was 2.4 in the 2017 cycle.
Conclusion: Both long-term and short-term MVRV holding may rise before the end of this cycle.
4. Pi-Cycle Top Indicator
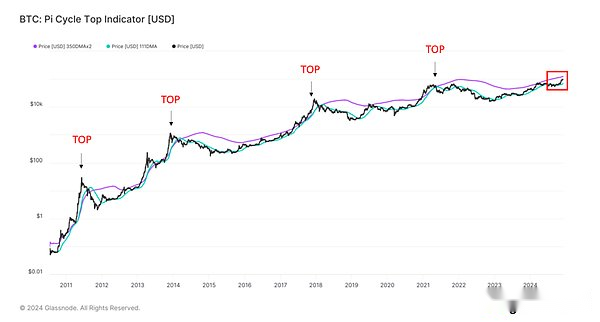
Similar to MVRV scores, Pi-Cycle Top Indicator (Pi cycle top indicator) has always been a relatively easy-to-use tool to identify cycle peaks.It measures development momentum by 2 times the 111-day moving average (green) and 350-day moving average.
When the market overheated, the shorter 111-day moving average crosses the longer 350-day moving average.
Conclusion: The shorter moving average has not shown a parabolic trend, indicating a sharp rise and fall at any time.
5. Market sentiment
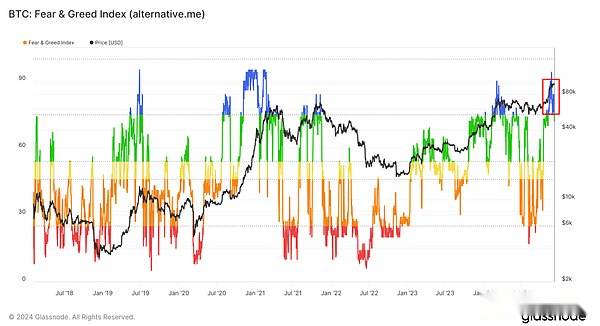
We have entered the “extreme greed” period since November 1 and have been there ever since.Of course, when others are greedy, you have to feel scared.
But here are some nuances to explore.For example, in early November 2020, we entered the “extreme greed” period for the first time.We stayed there until that cycle peaked in April (a cycle that lasted for 5 months (with a few brief pullbacks during the period) put us in “greed”).
Other off-chain indicators also show that the “extreme greed” period of this cycle has begun.For example, the popular encrypted YouTube channel still has about half the view volume that was at its peak in the previous cycle.Coinbase App ranks 15th (ranked No. 1 in the last cycle).
Finally, I see more people consider it to be a “local top” rather than a real “super cycle”.This is not what we usually see at the top.At the real top, it is more likely that few people will call for it, as extreme prosperity will come – many market participants believe that the “new normal” will continue.
Conclusion: Although there are some signs of prosperity (such as pump.fun, Microstrategy, meme coins, AI proxy, NFT regression, etc.), more extreme greed is likely to come.Expectations of volatility are human nature.
6. Attached SPX6900 data
Let’s take a look at SPX6900 – a meme coin we mentioned in our previous report article (and held in a small amount).I strongly feel that the trend of meme coins we have seen in this cycle is the prelude to what may happen in the future.
Why?
Obviously, retail investors prefer meme coins.People love gambling.Trading meme coins seems to have some “gambling” meaning.Anyway, this is what I think of meme coins.A gambling game.This is the utility of meme coins.It brings a sense of community and endless secretion of dopamine.
There is no doubt that meme coins are attracting new users.I think they have only benefits and no harm to the crypto world, and at the same time I admit that they are not suitable for everyone.Many meme coins are scams.Many people will suffer heavy losses due to playing this game.
Now, frankly, as someone who spent thousands of hours studying the crypto market, my intuition about the industry is basically a kind of “intuition”.But I want to share a sample of my SPX tracking so you can get a little bit about some analytical research.
When it comes to meme coins, I mainly look at the following content:
A large number of propagandists and social media remarks (idea share/focus)
A growing group of token holders
Projects that have already made big moves, such as sales or mergers.
市值1亿美元以上
充足的交易流动性
交易所上市(或未来可能上市)
大量鲸鱼玩家(表现出高度的信心)
明确的口号
一个做出极高价格预测的社区
Trading on Solana (easy to achieve through Coinbase, Phantom)
全球市场/可
Addressing Benefits
The SPX6900 seems to meet the above criteria.Here are some key points:
Note: Its social media account has grown from 9,000 followers to over 50,000 in the past few months.Its largest promotional account (Murad) grew from 110,000 followers to 550,000 during the same period—a few smaller promotional accounts were generated in the process.
Token holders grew: Its token holders grew from about 3,000 a few months ago to 79,000, the fastest growing on Solana (also available on Base and Ethereum).
Resilience: It had multiple corrections of over 70% before the parabola a few months ago.The peak price fell about 50% from $0.94 per token.It has been in the $0.49 and $0.72 range for the past seven weeks.
Whale: The number of SPX holders over $10,000 in Solana alone exceeds 44,000.This is almost half of WIF and more than half of Bonk (the market value of both is 5 times the former).It owns nearly one-third of Pepe’s token holders of more than $100,000 and $1 million.Pepe’s market value is 13.4 times that of SPX.
Global Markets: There are simple ideas that anyone can understand.Currently trading on KuCoin (Asia) and Bybit (UAE), Solana, Ethereum and Base DEX.
Slogans: “Reverse the stock market” and “Stop trading and believe in something”.
Ridiculous price prediction: Murad’s target is $100 billion.Note that Doge reached $90 billion in the last cycle, making people dare to dream.
That’s my point of view.Please note that I have no relationship with the SPX6900 or anyone related to the project.Investing in cryptocurrencies is very risky.Meme coins are at the far end of the risk curve.Our data query and analysis methods may be flawed, and the analysis may be incorrect.And the SPX6900 may soon fall to zero.
Please note that my data source is a private dune dashboard plus Holderscan.I’m studying more data, hoping to share it with you soon.
7. Conclusion
Do you have to sprint to the end of the year with all your might?
This is the question we mentioned at the beginning.Everyone wants to know where we will be by the end of the year.I’m not a trader, nor one who is too focused on short-term price movements, but I believe it’s possible that Bitcoin will move higher from now on – it could enter the $120,000 range before Christmas.
I am not 100% convinced of this.I always look at volatility.But I do think that Bitcoin prices will go higher in 2025.
Of course, we are also focusing on a broader economic situation.Global liquidity is currently showing some bearish signals.The U.S. dollar index has fallen from the 108 local high, but is still at a high level.CPI data will be released on December 12, and the Federal Reserve’s interest rate meeting will be held on December 18.
As always, please do your own research.There is a lot of volatility expected.Don’t invest in anything you can’t afford to lose.