Author: BREAD Source: X, @0xBreadguy Translation: Shan Oppa, Bitchain Vision
They finally reached the saturation of blobs again—which means they are no longer “almost free”.
How does L2 (Layer 2 network) react to this?How much ETH is burned?Although the answers are not very exciting, let’s discuss it.
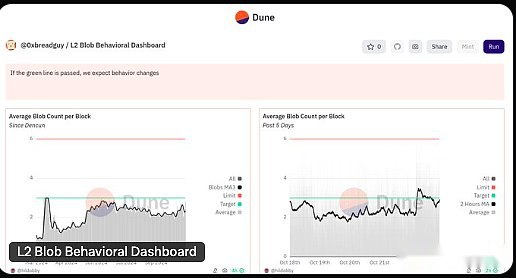
I also sorted out a dashboard to track the behavior changes of L2, let’s take a look.
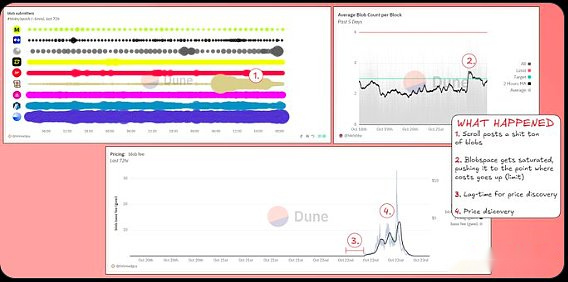
what happened?
Since the Dencun upgrade (March 2024), blobs has been basically free most of the time.
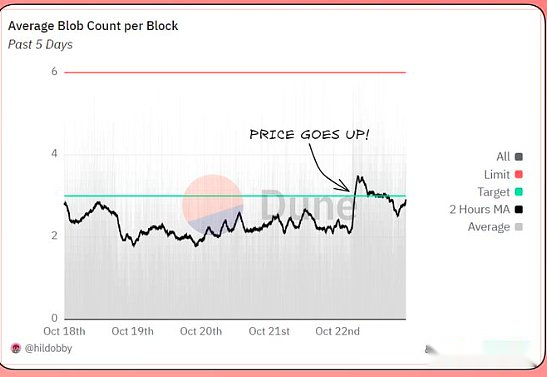
To make blobs no longer free, the number of blobs released by L2 collectively reaches 50% of the available blob space, which is the so-called “target”.This is very similar to the mechanism of Gas after Ethereum upgraded in 1559.
Yesterday, we reached this threshold:
Why did we reach this threshold?Scroll airdrop.
Scroll transaction volume increases dramatically when users apply for airdrops, meaning they need to publish more batches of data to Ethereum blobs than usual.
It can be seen from their posting behavior:
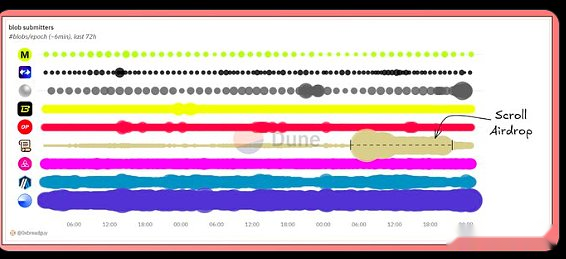
This sudden blob traffic has collectively exceeded the 50% threshold/upper limit, which means that the cost of all L2 using blobs has increased its interaction with Ethereum.
You can see the cost increase in the past 24 hours:
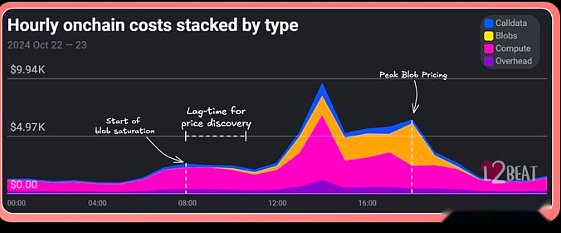
I marked the “Price Discovery Delay Time” in the picture above.This is the delay time from blob space saturation to price discovery.
Due to some complex calculations, this process is longer than expected and is currently planned to be resolved in the next Pectra update (EIP-7762).
Combining all of the above:
How much ETH is burned?
In these few hours, there was almost no burning.The rough calculation is about $13,000.
What do you want to observe?
I want to see if this airdrop surge is serious enough that L2 will change its behavior.
for example:
Will the data be published from blobs to calldate?Will publishing slow down or stop completely?
Judging from what I’ve seen so far, neither has happened, but it’s a good testing practice.I also spent the energy to organize a Dune dashboard for easier tracking of visual charts that show these behavior changes.