Source: On-Chain Mind, compiled by: Shaw Bitcoin Vision
Let’s be honest, most Bitcoin price predictions are more like horoscopes than rigorous analysis.Bold predictions and “sky-high” targets may be interesting, but in reality, they are nothing more than speculation.
They often ignore the fundamental mechanics of the Bitcoin network: transfers, the actions of long-term holders, and the valuation dynamics that actually drive cycles.
Here, we’ll take a different approach: take a deep dive into 6 on-chain indicators that have consistently signaled the tops of all previous cycles.
Key points overview
-
crystal ball on chain: From Factored terminal prices to delta peaks, 6 tried-and-true indicators with historical accuracy in predicting Bitcoin mania peaks.
-
Convergence is key: These indicators will diverge in volatile markets, but will converge during parabolic rises, forming a dynamic range of potential tops rather than a fixed value.
-
The power of average: A composite line that combines all 6 lines, adjusted for cyclical decay, is currently hovering around $180,000 and can be used as a reference for actual exit planning.
-
Focus on momentum rather than numbers: True tops are not determined solely by price levels, but by market behavior, the movements of long-term holders, and the end-of-cycle mania.
Why most price predictions fail
Before we dive into each of the metrics, we first need to understand why traditional forecasting methods rarely work.Charts with unclear trend lines are inherently subjective and mostly lack context.They do not take into account underlying network activity, long-term holder behavior, or cumulative value flows.Essentially, they rely on conjecture rather than observable data.
To truly predict a Bitcoin top, we need metrics based on network fundamentals—data that reflects real-world usage, accumulation, and distribution.This is where the value of on-chain analytics lies.
6 selected indicators
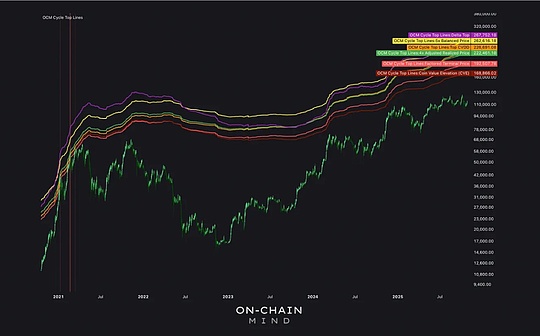
In the chart below, the 6 different colored lines represent different on-chain or market-derived estimates of potential cycle tops.
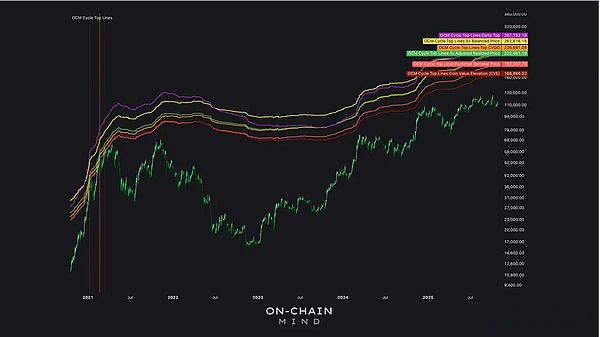
The forecast range is between $168,000 and $267,000, which is wider due to the current market consolidation phase.Such fluctuations are normal during mid-cycle downturns; during late-cycle market booms, indicators tend to converge.
The following is a detailed description of each indicator and its importance:
1. Factored terminal price (light red)
Factored terminal price is a classic indicator in on-chain analysis.It represents Bitcoin’s theoretical upper limit based on cumulative network value transfers and currency age.Historically, reaching this level indicates an extremely overheated market.It provides a mature upper limit and provides a benchmark against which to measure end-cycle price movements.
2. Increase in token value (dark red)
Coin Value Elevation (CVE) is a custom metric that tracks long-term price caps by combining Bitcoin’s holding time and changes in long-term holdings.Essentially, it measures the level of speculative mania and adapts dynamically to longer cycles.It often provides an early warning of later FOMO (fear of missing out) driven mania.
3. 5 times equilibrium price (yellow)
This metric combines realized price (average cost to investors) and terminal price, incorporating historical network valuations and current market sentiment.Multiplying by five yields a speculative top forecast that encompasses both network fundamentals and short-term market optimism.
4. 4 times adjusted actual price (green)
This metric is an improvement on the standard realized price multiple, which takes into account spent output profit margin (SOPR) and transaction volume.By multiplying the revised realized price by 4, it serves as a network-wide popularity indicator, highlighting when a large number of tokens are being sold at a high price.
5. Number of days until 4.5 times token value is destroyed (orange)
This metric focuses on liquidations of long-held tokens.This metric spikes when idle coins are finally transferred.Multiplying that by 4.5 gives a good fit with the all-time high, especially as long-term holders sold off during the frenzied rally.
6. Delta top (purple)
The delta top is calculated as 7 times the difference between the actual price and the time-adjusted average market capitalization, and it often coincides with the psychological pump point.These are the stages of irrational surges in which Bitcoin is pushed far beyond its reasonable value, marking the final frenzied stage of the bull market.
current signal
Currently, these six indicators suggest that a potential price top could be between $168,000 (CVE) and $267,000 (Delta top).In the current market stage of range-bound or volatile market conditions, it is normal for prices to fluctuate widely.
But this difference does not mean it is inaccurate.This reflects that Bitcoin has not yet entered a frenzied parabolic rise phase.Historical analysis shows that these indicators converge closely before a cycle top, as they did in 2017:
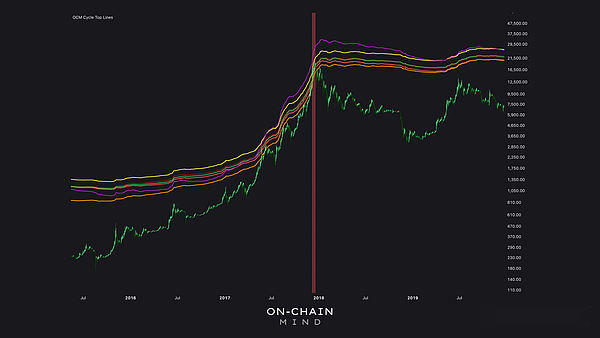
These 6 indicators have converged, matching the price of each previous cycle peak.
The value of comprehensive indicators
Reliance on a single metric can be misleading.In response to the conflicting signals, I created a composite average that combines all 6 indicators and incorporates a decay rate factor to account for cyclical diminishing returns.
This line, currently around $180,000, has been capturing the peaks of the cycle fairly reliably.Let’s take a look:
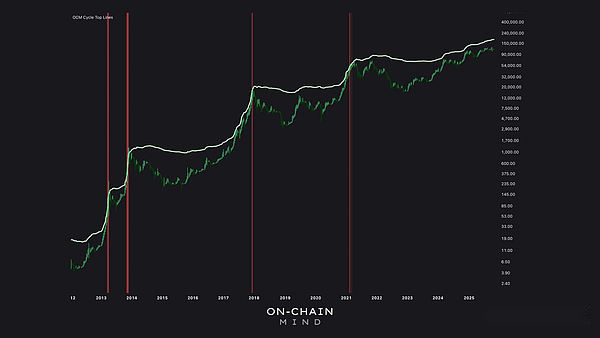
In 2021, the average Bitcoin price is close to $64,000.In 2017, amid a frenzy, Bitcoin reached $20,000.Even during the volatile market of 2013-2014, the price was hit before its pullback.These are not coincidences but reflect recurring patterns of investor behavior.
Why indicators alone are not enough
It is important to remember that reaching an indicator target does not equate to a price peak.Contextual factors such as market behavior, the speed of price movements, and other typical signs of late-cycle mania are equally important.It is normal for prices to diverge in the early to mid-cycle.Once Bitcoin enters its final vertical uptrend, indicators quickly converge.
My confidence in a macro top increases when prices begin to move closer to the average during a rapid rise.
Ultimately, these models don’t provide precise numbers, but rather a range of intersections that allow us to act based on evidence rather than emotion.
Addressing the remaining stages of the cycle
The key to this analysis is that the best forecasts are not about guessing a number, but about identifying patterns and behaviors that have recurred in previous cycles.By combining multiple on-chain and market indicators, we can get a clearer picture of possible peak areas, rather than blindly pursuing a single target.
It should be noted that the entire analysis is based on the premise that there will be a mania phase at the end of the Bitcoin cycle.While every previous Bitcoin cycle has gone through this phase, there is no guarantee that it will happen again this time.Even so, given the persistent and repetitive patterns of market behavior and the immutability of investor psychology, my base judgment is that we are likely to witness this phase again.
In the later stages of the Bitcoin cycle, even veteran Bitcoin holders can get caught up in a frenzied rally, so planning ahead with data-driven indicators is crucial.While Bitcoin may be maturing and its top amplitude may be milder than in previous cycles, even taking into account the decay factors I have applied, the available evidence suggests that we have not yet reached a typical cycle top.
Depending on how price action develops, the composite average could climb above $200,000 if this consolidation continues for longer, or fall if the macro-driven rally takes momentum faster than expected.
My plan during this cycle is to be patient, try not to get carried away by the market mania, and approach the top in a more rational rather than impulsive manner.Observing data and the behavior behind it is far more valuable than guessing at raw numbers.
Summary
-
multi-indicator approach: Relying on a single indicator carries the risk of missing opportunities; using 6 indicators comprehensively can provide a robust and historically proven cycle peak signal.
-
Dynamic intervals are better than static targets: The $180,000 moving average changes with market phases, giving us a flexible exit range rather than an exact target.
-
situational mania: Tops are reflected in holder behavior and parabolic moves, not just in price.Be prepared rationally to avoid falling into emotional traps.
-
Evidence is better than speculation: Using on-chain data allows decisions to be based on observable trends rather than hype or intuition.