Source: Digital Asset Research, compiled by Shaw bitchain vision
To be honest, I have seen enough of the four-year cycle theory. Today I will complain about why those who follow this theory will eventually fail.
These people have never studied time or cycle in their lives, but they are sure that the four-year cycle will be completed.They have no idea what they are dealing with and will eventually be forced to buy at a higher price.
This is an argument based on pure data, not a random guess.I’ve really had enough of the overwhelming pessimism and overcaution in the market, which made me very optimistic.
I’m not trying to exaggerate what will happen to this market, but this sentiment alone is enough to assert that I’m having enough of this nonsense.We will continue to rise, longer than these people stay sane.
A bull market will not peak when everyone is ready to take profits and move forward.It will peak as people rush to leverage and mortgage properties to buy more stocks.It will hit the top when your simple-minded friends/neighbors/cousin or uncle make a fortune, far beyond their ability, and then quit your job and switch to an investment professional.It will peak when no one is ever again, I mean no one is ever looking at the short side.
The situation is very different from that time. Whenever the S&P 500 fell 3%, investors fled the market; or the entire cryptocurrency world was planning to sell in the next three months, citing that some cycles they fabricated out of thin air had no strong data support at all.
What these new cycle experts do not realize is that the quality of a cycle depends on the underlying conditions on which it is formed.
The saying “The map is not territory” comes to my mind at this moment.
This means that even though you can keep staring at the map, that will only give you a general idea of where you are.The map won’t tell you there is a big hole 300 feet to the left.Nor will you tell you that there is a huge oak tree in the middle of the field.It won’t tell you that there is an abandoned shed a mile ahead.Of course, it won’t tell you that the temperature outside is as high as 110 degrees Fahrenheit and 50% humidity.Or are you in a jungle or a deciduous forest.
The map will show the coordinates and directions of your location, but it will not allow you to perceive the actual objects, environments, and terrain, which are exactly what you may encounter while navigating.
Cycles are a map that provides us with time frames and historical data to give us a rough idea of what we usually see, but the conditions behind the market are the real reality.
These conditions determine the increase in the cycle, decrease in volatility, increase in volatility, weaken volatility, etc.
The cycle we are in today is essentially different from the past three cycles in terms of conditions. Next, we will analyze in detail the reasons and how it is reflected in the chart.There is a key difference here, that is, the difference between the two statements “This time is different” and “It’s still the same but different”.
Price structure and behavior
From the beginning of this cycle, we can clearly see that the structure and behavior of the market are different from the previous cycle.The reason is that new assets and markets will go through different stages of growth and adoption.It reminds me of Peter Lynch’s view that the company’s style changes over time.
Companies are not always high-growth companies.Over time, they will transform into lower-growth businesses but will become mainstays in the industry.
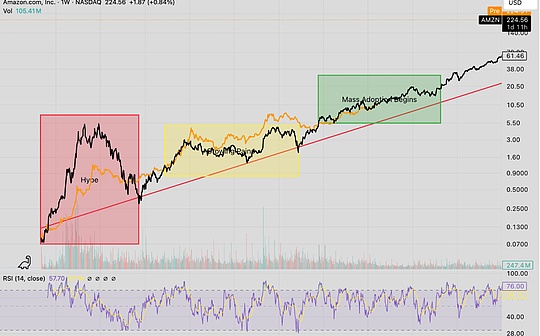
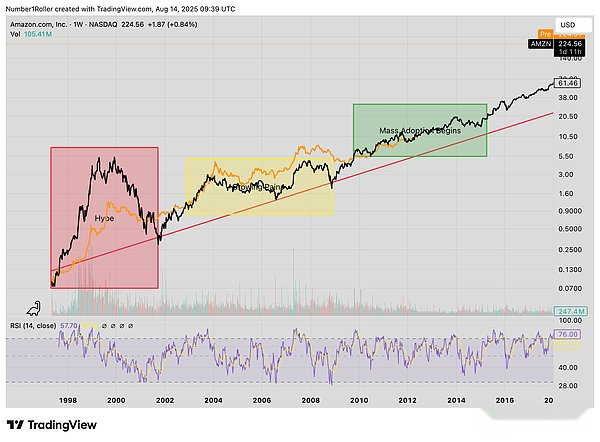
This is a typical adoption cycle, where the first cycle is the hype cycle, which is a typical adoption cycle, where the first phase is hype, the second phase is the pain and uncertainty of growth, and the last phase is the beginning of large-scale adoption, with most early users starting to dominate.
Let’s take a look at Amazon’s case, including its lifecycle and market structure, and compare it to Bitcoin and Ethereum.
Similarly, ETH is as follows
This is the argument we made during the first quarter plunge a few months ago.
We showcase the close relationship between Amazon’s current structure and behavior and what we currently witness in major cryptocurrencies.
Apparently, the early 2017 cycle was driven by a lot of hype, similar to Amazon in 1999.Then the bull market in 2021 is more structurally like sideways consolidation than a big expansion.This is a key test of whether the asset can survive the 2020 crash and the 2022 bear market to prove whether it deserves its name.
Similarly, Amazon (AMZN) didn’t hit record highs until after 2008.It took a long struggle to prove that it survived the bursting of the Internet bubble and was indeed able to build a long-term viable business.
Finally, we ushered in a phase of massive adoption, with most early groups beginning to join in.This is the last hurdle that Bitcoin and cryptocurrencies face as an asset.The last argument that someone once made—“What if the government banned it?”—is no longer there.Not only did the government not ban it, but instead tried its best to accept it.This is a typical process of adoption curve development.
OK, that’s great, we know we’re in the stage of mass adoption, but what does that have to do with the four-year cycle?
Dow Jones
Let’s take a step back and take a look at the Dow Jones Index.The Dow Jones Index is undoubtedly a favorite chart for any serious analyst, as its price history dates back to 1896 on Trading View.With over 100 years of data, this is the best quality data set we can base on.
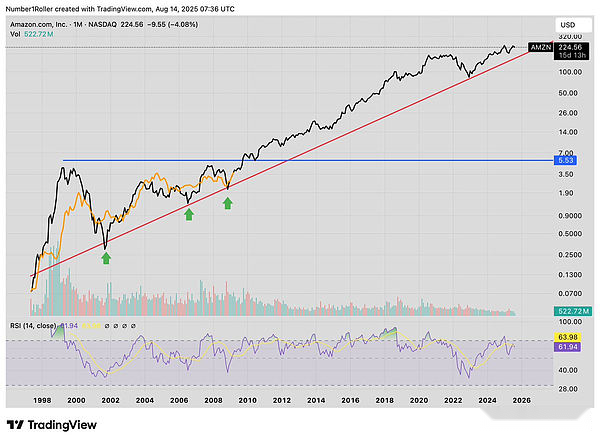
Looking back at the Dow Jones Index’s 1-year chart, we can see that there have been three consolidation in its history that lasted for more than a decade.After the first two consolidation period, its expansion period is approximately 17 to 23 years.The latest consolidation occurred between 2000 and 2013.Currently, the rise lasted only 16 years, and if it were the top, it would be the shortest in history.
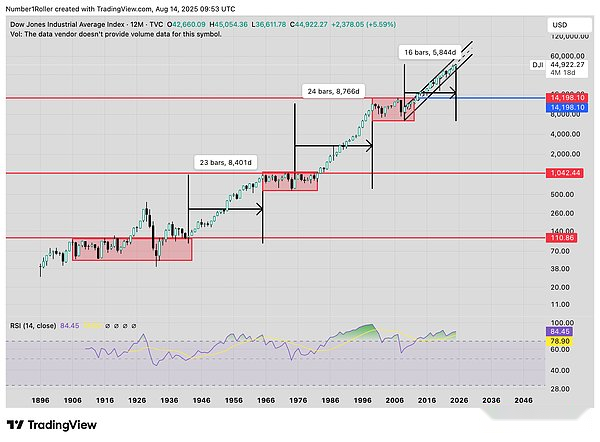
If we look closely at this 16-year bull market starting from the 2008 low, we will find that four times it has retested its previous highs.
The bottom of 2015 is a retest of the top of 2008.The bottom of 2020 is a retest of the top of 2015.The bottom of 2022 is a retest of the top of 2020.And the bottom of the last April is a retest of the top of 2022.
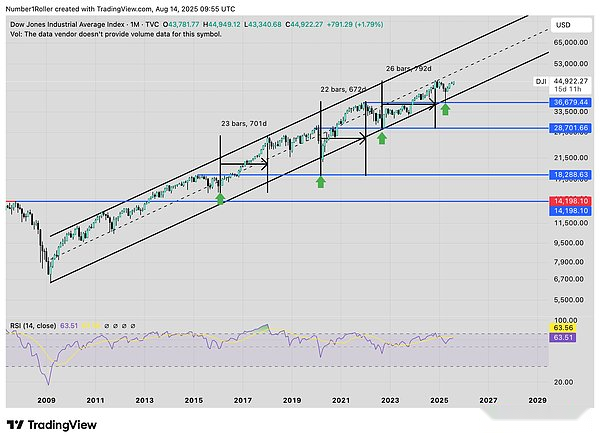
The market is as accurate as the clock at the same time, constantly changing the previous top into support level, while rising along this bull market channel.However, the key lies in the time when the market rises after each pullback.As can be seen from the above chart, the shortest rise period is 22 months.And now, we have only been up 5 months since the April low.If calculated as the shortest 22-month up cycle, the market will reach its high in early 2027.
This is another great data point and it shows you why I think the entire market is worth looking forward to at least in the next 12 months.In this environment, it’s hard for me to believe that cryptocurrencies will collapse while stocks continue to rise.
From a bull market to a bear and then to a bull market
Another reason that made me firmly believe that this bull market has just begun is the plunge in April.
I don’t think people fully recognize the extent of panic that crash has brought to the stock market and cryptocurrency markets.What we are talking about is the market sentiment, time and price, which are already at a serious bear market level.
The readings we see are comparable to the oversold levels and panic levels in 2020, 2008 and 2000.The market is completely collapsed.
This actually provides the momentum needed to start a new bull market, which will last and be strong beyond everyone’s expectations.
Let’s take a look at the situation with Ethereum (ETH).Ethereum’s plunge lasted longer than the FTX’s crash, and the price decline was almost the same.In my opinion, this is the end of a bear market that started at the top of the market in 2024.We formed a triple top in November’s last rise, followed by a 50-plus week bear market that ended with that collapse.
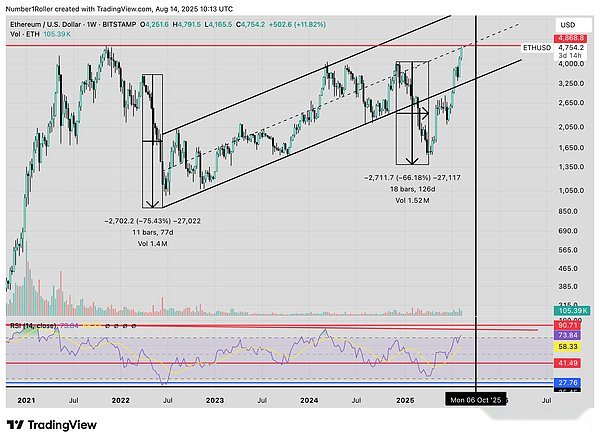
The reason for supporting this view is that Ethereum (ETH) has actually experienced a complete bull market.A typical bull market lasts between 90 and 120 weeks.Subscribers all know the importance of these time factors.
Interestingly, from the 2022 low to the 2024 high, it happened to be 90 weeks.In other words, I think it was a full cycle that was quietly completed, followed by a bear market cycle that started at that high point and lasted for a full year (similar to other bear markets) and ended in a crash in April.
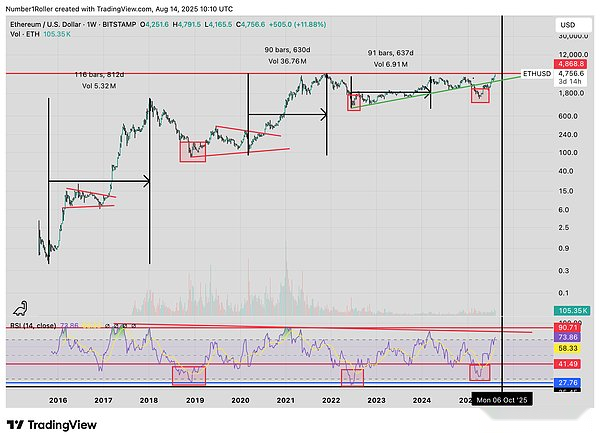
Just look at the Relative Strength Index (RSI) readings in the chart above.Weekly RSI has reached these levels only three times, and these three are at the bottom of the bear market.The April lows are equivalent to the bottom of the bear market, which gives us plenty of room for upside.
Copper/gold ratio
This is a great market relevance chart provided to me by Bravos Research.
Here is a copper/gold ratio chart that has been predicting the parabola and cycle tops of Bitcoin since 2013.
Every time the chart bottoms out and rebounds, Bitcoin begins its fastest expansion.Then, when it peaked, Bitcoin continued to be at a high level.
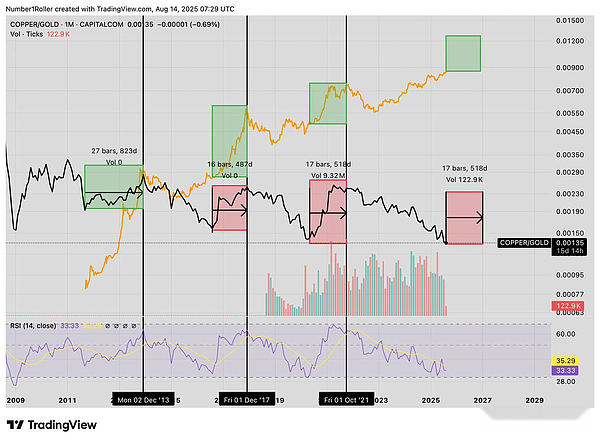
I think this picture is interesting for two reasons.Apart from the relevance (the most obvious I’ve ever seen), the time aspect is also interesting.This chart is currently at a low point, and assuming it is bottoming out, a typical bull cycle is 17 months.
From today for 17 months, that is to early 2027, it matches the situation with the Dow Jones Index that I just showed you.
Not only will it continue to rise for 17 months, it will coincide with the biggest stage of the Bitcoin bull market, which it allegedly hasn’t even begun.
By the way, I want to show you the data from Stansberry Research that highlights short positions on Bitcoin in the trader’s commitment.
We are currently at the highest level since 2021.
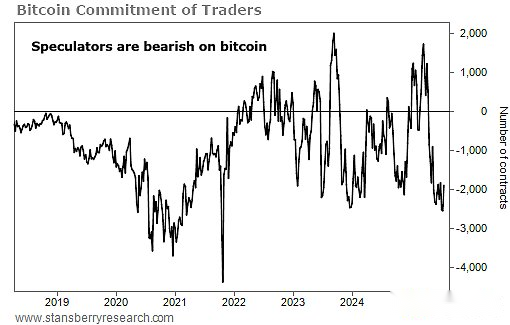
Stansberry’s data continues to show that whenever COT reaches a new extreme 1-year bearish level, the following price movements occur.
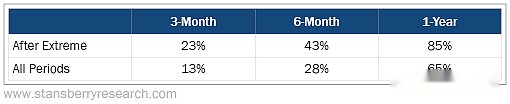
This is only 6 years of data, but it is inferred from this point in time next year that Bitcoin could soar to $230,000, which again suggests that based on this extreme reading, the cycle will be longer.
Altcoins
Next is the altcoins.I have nothing to say about altcoins, I just think the prospects for the big market of the altcoin market are very bright.However, large market volatility takes time, and as you can see, if these volatility requires time to complete, then a four-year cycle is meaningless.
Take a look at the “other” chart below and if you feel there are any bearish signs, you can’t call yourself an analyst.With this structure alone, you can have extremely optimistic expectations of altcoins.
Furthermore, we know that the longer it takes for the market to break through the old highs, the greater the volatility.
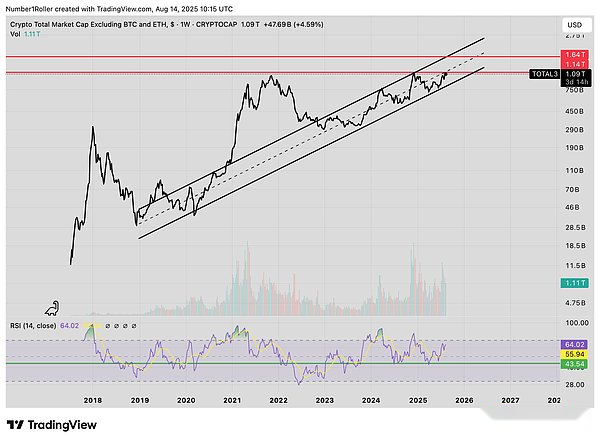
Once this situation breaks out, it’s hard to say how far it will develop, but I highly doubt it will end after nearly 5 years of brewing and lasting just 8 weeks.
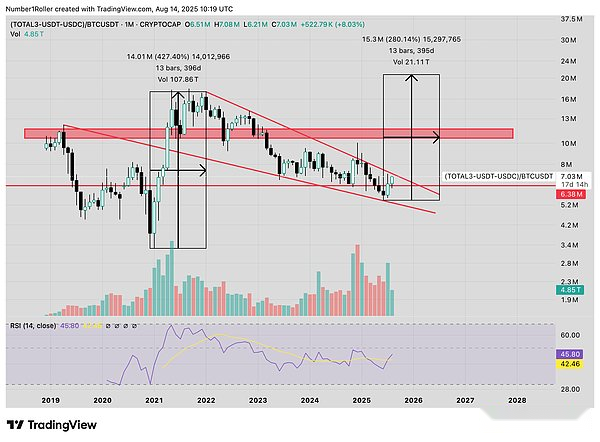
From the comparison of TOTAL3 with BTC below, we can get a rough idea of some time required.Not only is it just starting out and not breaking through yet, but the usual operating cycle is 12 to 13 months, which means it won’t be known until the second half of next year.
Then take a quick look at the overall “other” chart, and we see the same situation, but the time span is longer.What’s different about this recent bear market is that it lasts longer than ever.So when it breaks through, we should expect a big rise, and more importantly, it will last for a long time.
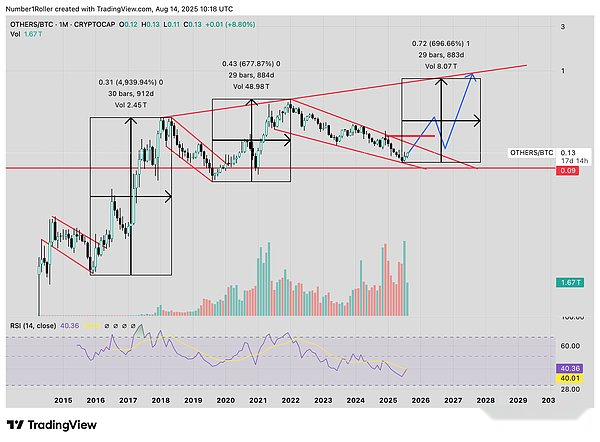
It is impossible for you to carefully analyze any of the above charts and come to the conclusion that the breakthrough will end within eight weeks.Judging from these charts, we expect the upward trend to last for 12 to 18 months.
Half theory
Finally, let’s talk about the halving theory. In my understanding, this is the fundamental reason for the four-year cycle, right?
If the halving theory is correct, then why did we create a new ATH before the halving in 2024?According to this theory, we should have created a new ATH after halving.
And, why do we collapse in the first quarter of the fourth year of the four-year cycle?This has never happened before.But everything is still the same, isn’t it?
In my opinion, there seem to be many cracks, but these people are like bears in a bull market, refusing to give up and unwilling to accept the facts.
Here is a novel idea proposed by the famous BTC OG Adam Back, who was even cited in the white paper.
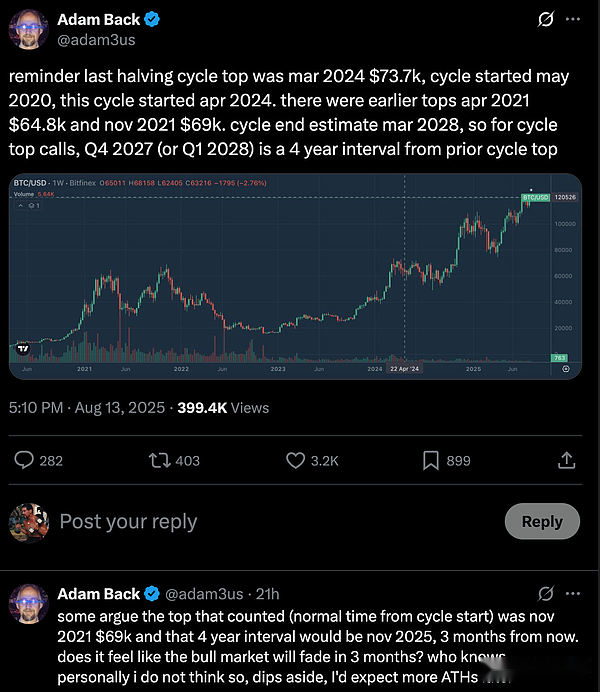
He noted that the top of the cycle is actually in April 2024 because technically that is the culprit of the halving cycle, and the next halving cycle will end in mid-2028.
Interesting point of view, and in my opinion, it makes sense.This doesn’t mean that Bitcoin won’t have a pullback until 2028, or that 2028 is what I think of as a cycle top target, which just shows that the halving has no effect on Bitcoin price.
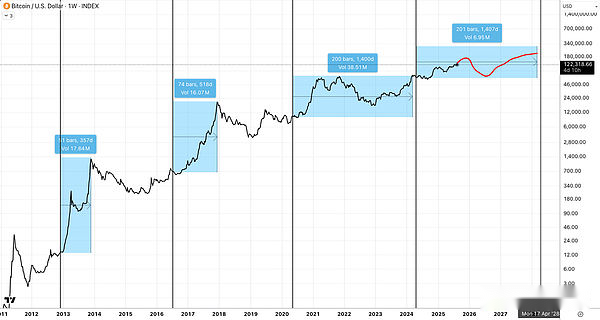
Below is a view of Bitcoin halving and cycle top
Let’s summarize
This is indeed a bit exaggerated, but I do strongly believe that there is a lot of data that this four-year cryptocurrency cycle will not end.In my opinion, the current reverse view is clear, both stocks and cryptocurrencies will rise sharply and last longer.
Although everyone is worried about the four-year cycle and overvalued valuations, I suggest a good look at the actual data and facts to support this concern.
Any market veteran can tell you that the current market sentiment is simply not enough to support the market to reach its peak.
在以太坊尚未创下新高、山寨币即将突破四年盘整区间之际,太多人随时准备抛售,而从道琼斯指数和铜金比来看,市场告诉我们,行情的上升空间远比人们想象的要大。
As I said on X the other day, long cycles are harder, not easier.And because people think we are still in the early stages, the cycle won’t last too long, because then they will make a fortune.This is not the case.The longer the cycle, the greater the chance of people losing money.
Not many people consider the fact that Ethereum did experience a complete bull market from its June 22 low to its April 24 high, followed by a full year of bear market.From a time, price and market sentiment perspective, it all shows that this view is accurate, but most people ignore it.
Worry, fear and doubt will continue to push this bull market to last far more than anyone expected.The fact that most people are trapped in the four-year cycle is just adding another piece of fire to the fire.
Remember that the market will do everything to deceive as many people as possible.
Although we are entering a long bull market, this does not mean that the process will be smooth sailing.There will be a decline, a pullback and a correction along the way, which will even confuse the most experienced veterans.Having a framework that understands the market situation is crucial to help you find the right place that many investors are striving to find.