
Author: Kevin, Movemaker researcher; Source: X, @MovemakerCN
The Vaults ecosystem on the Hyperliquid platform provides investors with a unique window to observe and participate in on-chain derivatives strategies executed by professional managers.This article conducts a systematic quantitative analysis and strategic deconstruction of the top treasury with the most outstanding performance in this ecosystem.
Evaluation framework and data methodology
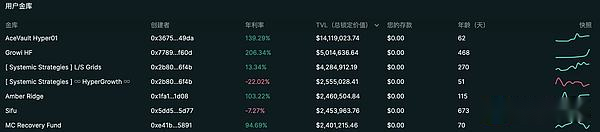
In order to conduct an objective and multi-dimensional comparison, we selected five representative vaults on Hyperliquid that are among the top in terms of management scale and performance. They are: AceVault, Growi HF, Systemic Strategies, Amber Ridge and MC Recovery Fund.
–
Our evaluation framework will revolve around the following core indicators to build a complete picture of each vault strategy:
-
Performance indicators: total revenue during the period (PNL), number of profits, total number of transactions, win rate (Win Rate), profit and loss factor (Profit Factor).
-
Trading efficiency indicators: average single profit and loss, average single profit, average single loss.
-
Risk management indicators: Maximum drawdown (Max Drawdown), standard deviation of single profit and loss, profit and loss volatility ratio (i.e. average profit and loss/standard deviation).
-
Strategy attribution indicators: profit and loss contribution of each currency, long and short position preference of specific currencies.
For data acquisition, we extracted the longest available historical transaction data for each vault stored by Hyperliquid.It must be pointed out that due to the data storage limitations of the platform, the historical data period of High Frequency Trading Vault (HFT) is relatively short, and the analysis window we can obtain ranges from three days to two months; while for strategies with lower trading frequency, we can observe longer historical performance.
AceVault Hyper01
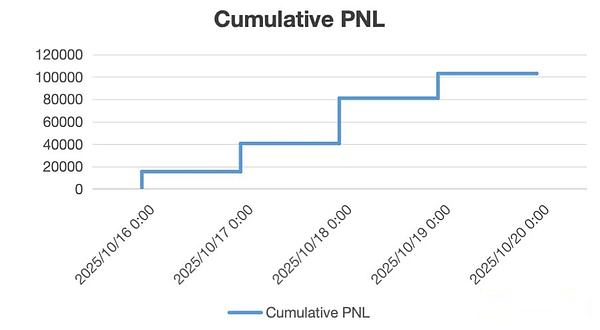
Analysis data period: October 16, 2025 – October 20, 2025
1.1 Strategy Overview and Market Position
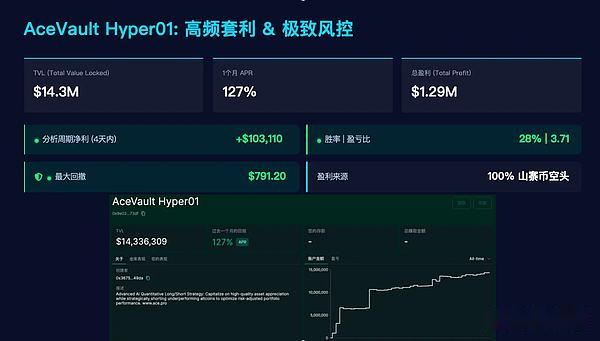
AceVault Hyper01 is not only one of the largest strategy vaults in terms of assets under management (TVL) in the Hyperliquid ecosystem, but its performance is equally impressive.As of October 20, 2025, the vault’s TVL has reached a whopping $14.33 million.Since its operation in August 2025, this strategy has achieved a cumulative profit of US$1.29 million, and its annualized return (APR) in the past month is as high as 127%, showing strong and sustainable alpha generation capabilities.
1.2 Trading behavior and performance quantification
During the four-day analysis period we selected, the vault recorded a total of 19,338 position closing records, providing a highly accurate sample for us to deconstruct its strategy.
-
Core performance indicators:
– Net Profit (Total PNL): +$103,110.82
– Win Rate: 28%
– Profit Factor: 3.71
-
Profit and loss structure analysis:
– Average profit and loss per trade (Avg. PNL): +$5.33
– Average profit per trade (Avg. Win): +$26.00
-Avg. Loss: $2.70
-
Risk indicators:
-Max Drawdown: $791.20
-StdDev of PNL: 26.84
– Profit/loss volatility ratio (Avg. PNL / StdDev): 0.199
1.3 Strategy portrait and risk attribution
Strategy portrait: high frequency, asymmetric, systematic short selling
AceVault trades at the highest frequency of any vault and is a very high-frequency trading (HFT) strategy.With a win rate of only 28% and a profit-loss factor of 3.71, this presents a classic trend-following or momentum strategy characteristic: the strategy does not rely on a high win rate, but rather on fully covering large, but tightly controlled losses (average loss of $2.70) with a small number of very profitable trades (average profit of $26.00).
This highly asymmetric profit and loss structure is the core of its profit model.
Profit Attribution: A Total Victory for Altcoin Bears
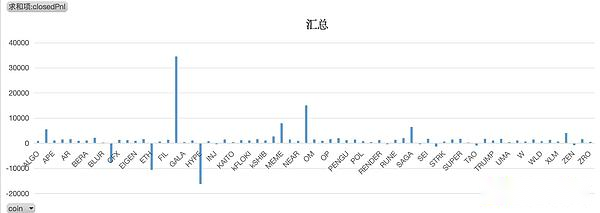
This strategy trades a wide range of assets (covering 77 assets), but its long and short operations show amazing consistency and discipline:
-
Long operation: only executed for the three mainstream assets of BTC, ETH and HYPE.
-
Short Operations: Only short positions on all other 74 altcoins.
During this analysis period, the profit source of the strategy is extremely clear:
-
Short position: Cumulative profit +$137,804
-
Long position: Cumulative loss $33,726
This suggests that AceVault’s entire net profit comes from its systematic shorting on 74 altcoins.The position that contributed the most profit came from the short position in $FXS (+$34,579), while the losses were concentrated in the long position in $HYPE (-$16,100).
Risk Management: Ultimate Loss Control
This strategy demonstrates textbook risk management capabilities.With a TVL of $14.33 million and a trading frequency of nearly 20,000 transactions, its maximum drawdown within four days was strictly controlled at $791.20, which is an extremely eye-catching figure.This is highly consistent with the average single loss of -$2.70, proving that the strategy has a systematic and extremely strict stop-loss mechanism built into it.
1.4 Summary
AceVault Hyper01 is a high-frequency strategy with clear logic, rigorous execution and highly systematic approach.The core model is by holding long positions in a basket of mainstream assets (perhaps as a beta hedge or long-term position), while systematically executing a high-frequency shorting strategy on the broader altcoin market.
During the market cycle analyzed, the excess return of this strategy was entirely derived from its accurate capture of the falling market of altcoins.Its top-notch risk control system ensures that when executing low-win rate strategies, losses are strictly limited to a controllable and tiny range, thereby achieving healthy and strong overall profits.
Growi HF
Analysis data period: August 7, 2025 – October 20, 2025
2.1 Strategy Overview and Market Position
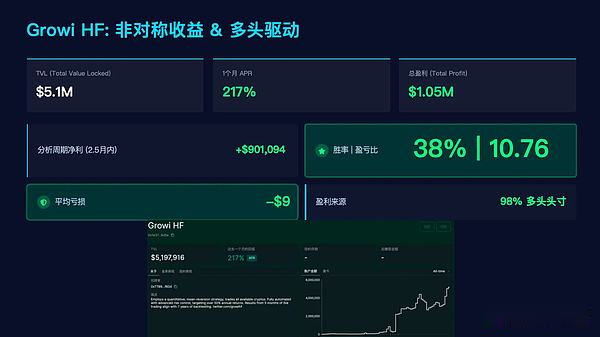
Growi HF is a strategy vault in the Hyperliquid ecosystem that has shown strong growth momentum.As of October 20, 2025, its total locked value has reached $5.1 million.The vault has been operating since July 2024 and has a public track record of over one year, with cumulative profits of $1.05 million.Its annualized return in the past month is as high as 217%, showing that its strategy has excellent alpha generation capabilities and strong profit explosion.
2.2 Trading behavior and performance quantification
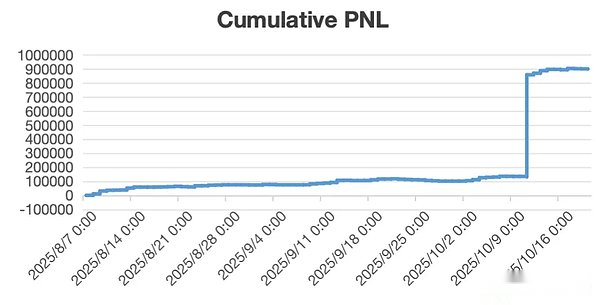
Our analysis is based on the vault’s detailed trading data over the past two and a half months, during which a total of 16,425 position closings were recorded, and its trading frequency remains highly active among similar vaults.
-
Core performance indicators:
– Net profit: +$901,094
– Winning rate: 38%
– Profit and loss factor: 10.76
-
Profit and loss structure analysis:
– Average single trade profit and loss: +$54.86
– Average profit per trade: +$159.00
– Average single trade loss: $9.00
-
Risk indicators:
– Maximum drawdown: $16,919
– Standard deviation of single profit and loss: 1841.0
– Profit/loss volatility ratio: 0.030
2.3 Strategy portrait and risk attribution
Strategy Portrait: Extremely Asymmetric “Bull Hunter” Similar to AceVault, Growi HF’s profit model is also based on an asymmetric profit structure, but its expression is more extreme.A win rate of 38% and a profit-loss factor of 10.76 reveal the core of his strategy: using a small number of (but extremely profitable) transactions to completely cover the majority (but extremely small losses) of transactions.
Its profit and loss structure (average profit $159 vs. average loss -$9) is a perfect reflection of its strategy.This is a typical “Cut Losses Short, Let Winners Run” trend following strategy.
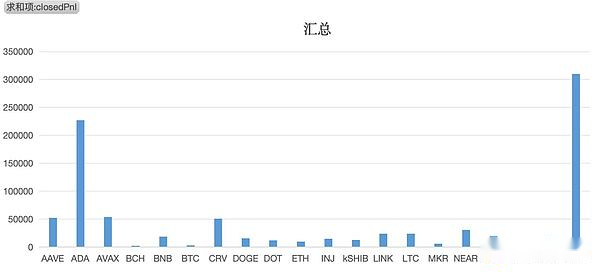
Profit Attribution: Systematic Long Preference and Excellent Asset Selection The trading behavior of this strategy shows a strong bull bias.Of the 20 trading assets analyzed, only two-way operations were performed on $LTC, while only long operations were performed on the remaining 19 assets.
-
Directional P&L: The vast majority of the strategy’s profits came from long positions (cumulative profit +$886,000), while the only short exposure ($LTC) also contributed a small amount of profit (+$23,554).
-
Currency Profit and Loss: The strategy’s asset selection capabilities are extremely good.There were no net losses in all 20 assets it traded during the analysis period.The position with the largest profit contribution comes from the long position of $XRP (+$310,000), which is the core profit engine of this cycle.
Risk Management: A Combination of Volatility Tolerance and Strict Stop Loss Growi HF’s risk management model is very different from AceVault’s.Its high single-trade standard deviation of 1841 indicates that the strategy does not attempt to smooth the PNL fluctuations of a single trade, but is willing to tolerate huge profit variability in exchange for the opportunity to capture huge profits (“Home Run”).
However, this high tolerance for upside volatility contrasts with an extreme intolerance for downside risk.The average single loss of -$9.00 and the maximum drawdown of only $16,919 (very low compared to the TVL of 5.1 million and the profit of 0.9 million) strongly prove that its risk control mechanism is extremely effective and can systematically kill losses before they expand.
2.4 Summary
Growi HF is a highly asymmetric, long-driven trading strategy.It does not pursue a high winning rate, but uses an extremely strict loss control system (the average loss is only $9) to “hunt” the bull trend with high explosive power (the average profit is $159).
During the analyzed market cycle, the strategy demonstrated strong profitability and near-perfect asset selection (0 losing assets) in the long direction.The sophistication of its risk model is that it successfully combines “high volatility on a single PNL basis” with “systematic downside risk protection” to achieve extremely outstanding risk-adjusted returns.
Systemic Strategies
Analysis data period: October 13, 2025 – October 20, 2025
3.1 Strategy Overview and Market Position
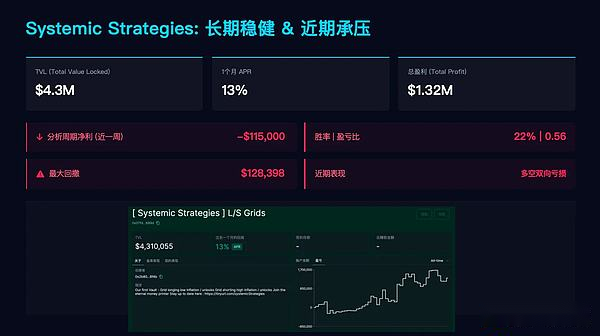
Systemic Strategies is a strategy vault in the Hyperliquid ecosystem with both significant management scale and long-term operating history.As of October 20, 2025, its total locked value is $4.3 million.The vault has been operating since January 2025 and has a track record of over nine months, having achieved cumulative profits of $1.32 million, demonstrating the historical effectiveness of its model over longer time periods.
However, its annualized return (APR) over the past month was just 13%, a figure that suggests the strategy’s profitability has slowed significantly in the near term.
3.2 Analysis of recent (past week) trading performance
The following is an in-depth analysis based on the vault’s 11,311 closing transactions over the past week.The data clearly shows that the strategy has encountered severe headwinds in the recent market environment, resulting in significant performance drawdowns.
-
Core performance indicators:
– Net profit: -$115,000
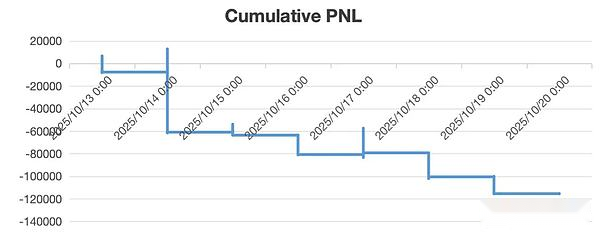
– Winning rate: 22%
– Profit and loss factor: 0.56
-
Profit and loss structure analysis:
– Average single trade profit and loss: -$10.22
– Average profit per trade: +$61.00
– Average single trade loss: $30.00
3.3 Strategy portrait and risk attribution
Strategy Portrait: A Failed Asymmetric Model The vault’s breakeven factor is well below its breakeven point of 1.0, a direct quantitative reflection of its net loss for the cycle.
However, a crucial detail is hidden in the profit and loss structure: the strategy’s average profit per trade (+$61) is still twice the average loss per trade (-$30).This shows that the “asymmetric return” logic of its strategy at the design level (ie, earning more when making profits and controlling losses when losing money) itself has not been destroyed.
Therefore, the huge losses in this cycle are not due to the failure of risk management (such as stop loss), but to the catastrophic inaccuracy of signal generation (Signal Generation) or market timing, resulting in an extremely low winning rate of only 22%.In other words, the strategy’s trading system generated a large number of erroneous trading signals during the week. Although the stop loss cost of each error was controllable, its cumulative effect eventually overwhelmed profits.
Risk Exposure and Performance Attribution This strategy has come under significant pressure recently, and its risk metrics bear this out:
-
Exposure: Maximum drawdown over the analysis period is as high as $128,398.This value almost equaled or even exceeded the total losses for the week, indicating that the strategy experienced a sharp capital drawdown that did not recover during the analysis period.
-
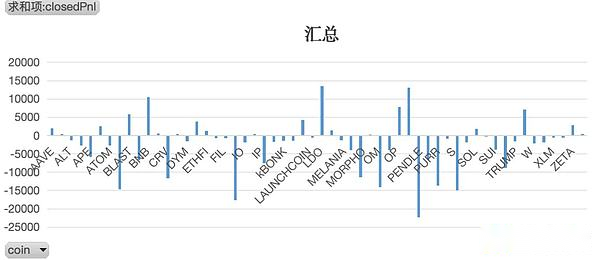
Directional attribution: Losses are widely distributed in both long and short positions.Among them, the accumulated loss for short orders was $94,800, and the accumulated loss for long orders was $23,953.This strongly suggests that during this analysis period, the strategy went against the market in both its bullish and bearish signals.
-
Currency attribution: Of the 56 currencies traded, most recorded losses.The largest single-currency loss came from the long position of $PENDLE (-$22,000), while the largest single-currency profit came from the long position of $LDO (+$13,000), but the size of the individual profits was far from enough to offset the widespread losses.
3.4 Summary
Systemic Strategies’ long-term profitability record demonstrates the historical effectiveness of its model.However, the performance data of the last week provide us with a typical case of strategic model failure in adapting to a specific market environment.
This strategy has encountered challenges in both long and short signals in the current market cycle, leading to a serious collapse on the winning rate side (rather than the profit-loss ratio structure side), and ultimately triggered a large capital retracement.This performance can be viewed as an important stress test of the strategy’s model, clearly revealing its vulnerability to certain market conditions.
Amber Ridge
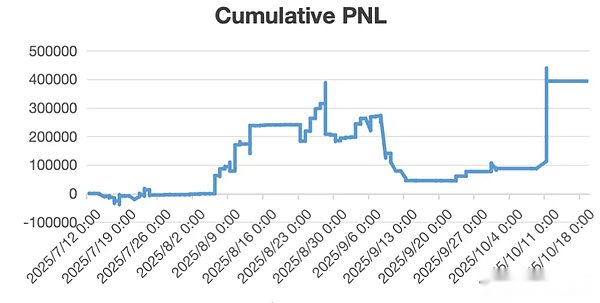
Analysis data cycle: July 12, 2025 – October 20, 2025 (full life cycle of the strategy)
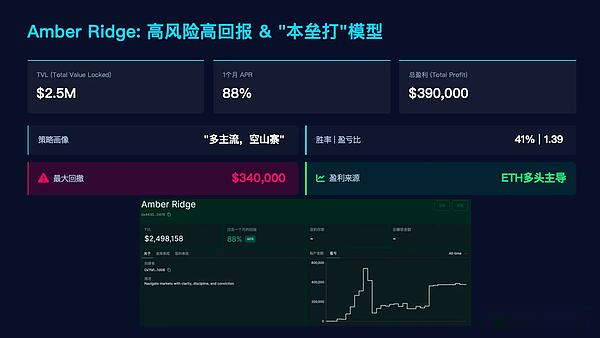
4.1 Strategy Overview and Market Position
Amber Ridge is a strategy vault in the Hyperliquid ecosystem with a very clear strategy image and a distinctive style.As of October 20, 2025, its total locked value is $2.5 million.The vault has made a cumulative profit of US$390,000 since it started operations in July 2025. Its annualized return in the past month reached 88%, showing significant profit potential.
4.2 Trading behavior and strategy portrait
The analysis below is based on all 4,365 historical transactions of the vault since its inception, which provides us with a complete deconstruction of its strategy.
-
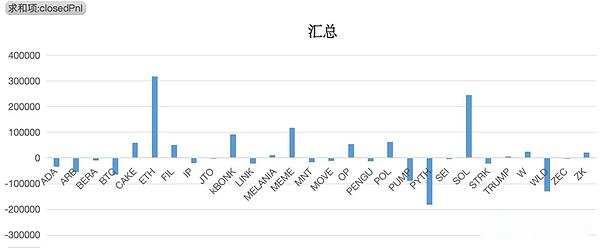
Strategy portrait: clear “long mainstream, short copycat” structure The portrait of this strategy is extremely clear, showing a typical **”long mainstream, short copycat” hedging or relative value structure**.Across the 28 assets traded, this strategy is extremely disciplined:
– Long operation: only executed for the three mainstream assets of Bitcoin, Ethereum and SOL.
– Short Operations: Only short positions are performed on the remaining 25 altcoins.
4.3 Analysis of profit and loss structure
-
Core performance indicators:
– Net profit: +$390,000
– Winning rate: 41%
– Profit and loss factor: 1.39
-
Profit and loss structure analysis:
– Average profit and loss per trade: +$90.00
– Average profit per trade: +$779.00
– Average single trade loss: $389.00
The strategy’s P&L factor of 1.39 indicates healthy profitability.Its profit and loss structure (average profit +$779 vs. average loss -$389) is a typical manifestation of the discipline of “cutting off losses and letting profits run”.Different from the high-frequency strategy, the absolute value of the average single loss of this strategy is larger, but its explosive power on the profit side is enough to cover these losses.
4.4 Risk Analysis: High Volatility and Huge Drawbacks
While this strategy achieves impressive returns, it also comes with extremely high risk exposure.
-
Risk Exposure: Its historical maximum drawdown is as high as $340,000.
-
Key Insight: This drawdown value is almost equal to the strategy’s total cumulative profit ($390,000).This reveals the strategy’s extremely high volatility and fragility, with investors historically facing extreme risks of giving back nearly all their profits.
-
Performance volatility: The standard deviation of a single profit and loss is as high as 3639, while the profit and loss volatility ratio is only 0.024.This extremely low value confirms from the data that the profit of this strategy does not come from stable accumulation of small amounts, but is highly dependent on a few huge profitable transactions to establish victory.
4.5 Profit attribution analysis
-
Directional P&L: A strategy’s entire net profit is derived from its long positions.The data shows that the long position made a cumulative profit of $500,000, while the short position made a cumulative loss of $110,000.This data clearly shows that during the market cycle analyzed, the gains from long mainstream coins far exceeded the losses from short altcoins.
-
Currency Profit and Loss: High Concentration of Profit and Loss The performance of this strategy shows extreme concentration:
– Maximum profit: From the long position of $ETH, contributed +$320,000 profit.This single transaction contributed almost 82% of the total profit.
– Maximum loss: $180,000 loss from short position in $PYTH.
4.6 Summary
Amber Ridge is a “long mainstream, short copycat” strategy with clear logic but extremely high risk.Its historical performance demonstrates the model’s huge profitability under specific market cycles where mainstream assets rise faster than altcoins.
However, investors must clearly understand its risk-return characteristics:
-
High concentration of profits: The success of the strategy relies almost entirely on a few “home run” trades (especially long $ETH).
-
Huge Potential Drawdown: The strategy comes with a huge potential drawdown risk almost equal to its total profit.
This is a typical “high risk, high return” strategy. Its performance is highly dependent on market beta and the manager’s timing ability. It is only suitable for investors with strong risk tolerance.
MC Recovery Fund
Analysis report analysis data period: August 10, 2025 – October 20, 2025 (complete life cycle of the strategy)
5.1 Strategy Overview and Market Position
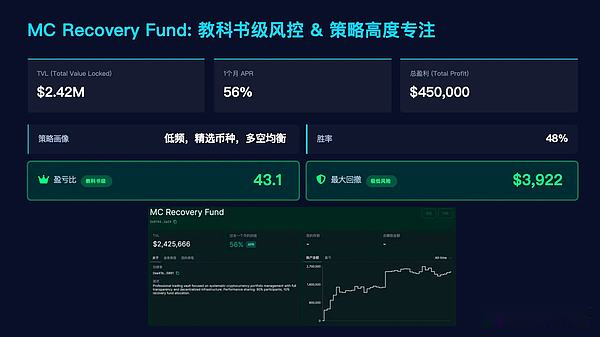
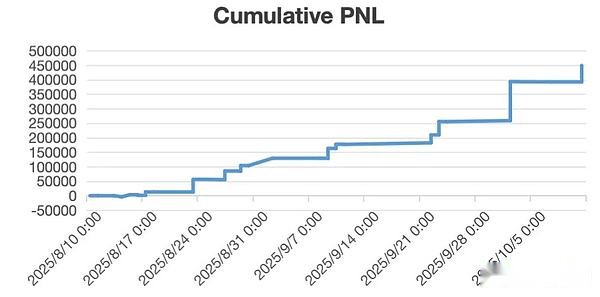
MC Recovery Fund is a highly focused strategy treasury in the Hyperliquid ecosystem.As of October 20, 2025, its total locked value is $2.42 million.The vault has made a cumulative profit of $450,000 since it started operations in August 2025, and its annualized return in the past month was 56%, showing a solid return capability.
5.2 Trading behavior and strategy portrait
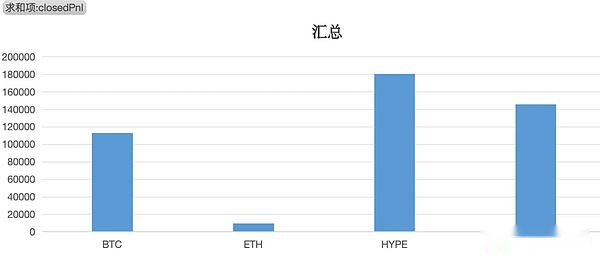
The analysis below is based on all 1,111 historical transactions of the vault since its inception.Its trading frequency is the lowest among the five vaults analyzed in this analysis, clearly reflecting its non-high-frequency, more selective trading style.The strategy is highly focused and only operates four assets: Bitcoin, Ethereum, SOL and HYPE.
-
Strategy Style: Excellent long-short bi-directional profitability The vault demonstrates excellent long-short bi-directional alpha capture capabilities.Specifically:
– Execute long and short two-way transactions on $BTC and achieve profits.
– Executed only long positions on $ETH and $HYPE, both were profitable.
– Execute only short positions on $SOL and achieve profits.
This shows that this strategy does not simply follow market beta, but holds clear and preset directional judgments on specific assets based on its independent investment research framework.
5.3 Analysis of profit and loss structure
-
Core performance indicators:
– Net profit: +$450,000
– Winning rate: 48%
– Profit and loss factor: 43.1
-
Profit and loss structure analysis:- Average profit and loss per trade: +$404.00- Average profit per trade: +$862.00- Average single trade loss: $18.00
The strategy’s win rate (48%) is close to breakeven, but its breakeven factor is a staggering 43.1.This is an extremely rare and outstanding value that is the core cornerstone of the strategy’s success, meaning that its cumulative total profit is more than 43 times its cumulative total loss.Its profit and loss structure is perfect: the average single loss is strictly controlled at an astonishing -18 US dollars, while the average single profit is as high as +862 US dollars.
5.4 Risk Analysis: Ultimate Risk Control
The strategy’s risk management capabilities are its most prominent highlight.
-
Risk Exposure: Its historical maximum drawdown is only $3,922.Compared to its cumulative profit of $450,000 and TVL of $2.42 million, this retracement is minimal and almost negligible.
-
Performance Volatility: Although the standard deviation of single wins and losses is high (2470), this is not due to out-of-control risk, but is entirely driven by a few huge profitable trades.The extremely low average drawdown (-$18) and the tiny maximum drawdown combine to prove that this strategy is extremely stable and consistent on the risk side (i.e. losing trades).
5.5 Profit attribution analysis
-
Directional Profit and Loss: The strategy achieved substantial and balanced profits in both the long and short directions.The accumulated profit for long orders is $240,000, and the accumulated profit for short orders is $210,000.This proves that this is a mature “all-weather” strategy that can adapt to different market directions.**
-
Currency Profit and Loss: Profit was achieved in all four currencies traded.Among them, the long position of $HYPE contributed the largest single currency profit (+$180,000) and is one of the core profit sources of the strategy.
5.6 Summary
MC Recovery Fund is a textbook example of risk management.It does not pursue high-frequency trading or high winning rates, but captures Alpha through a near-perfect, highly asymmetric profit and loss structure to achieve long-term stable growth.
Central to its success is a highly disciplined system that keeps the vast majority of losing trades strictly within a very small, fixed range (an average of -$18), while allowing profitable positions to fully develop.This is a high-quality strategy with high maturity and low risk, suitable for investors looking for stable returns.
Summarize
Through in-depth quantitative analysis of Hyperliquid’s five top vaults (AceVault, Growi HF, Systemic Strategies, Amber Ridge, MC Recovery Fund), we were able to penetrate the surface of high APR and total profits and gain insight into the core of their strategy – not all high returns are “created equal.”
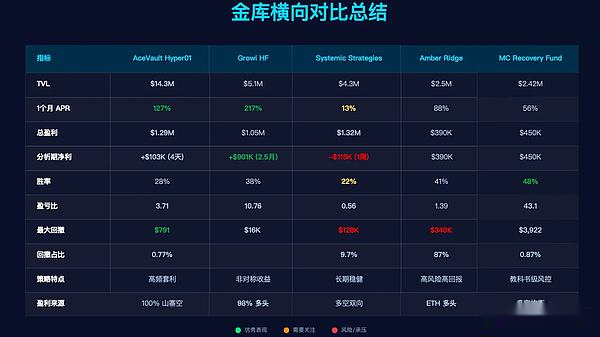
Our analysis revealed several key findings:
-
Risk control, not win rate, is the cornerstone of top strategies: Contrary to conventional wisdom, the most successful vaults in this analysis do not rely on high win rates (AceVault 28%, Growi HF 38%, MC Recovery 48%).Instead, their victory stems from a common, strictly enforced logic: an asymmetric profit and loss structure.
-
The epitome of “asymmetric victory”: MC Recovery Fund is the ultimate expression of this model.Its profit-loss factor of 43.1 is astonishing, and behind it is near-perfect risk control: the average single loss is only $18, while the average profit is as high as +$862.The same goes for Growi HF (P&L factor 10.76).This shows that their profit model is not based on “win more times” but on “only being slightly hurt when losing money and being able to capture huge returns when making profits.”
-
The maximum retracement is the “stress test” of the strategy: Comparing the “maximum retracement” and “retracement proportion” columns in the chart clearly divides the robustness of the strategy.- MC Recovery Fund (Drawdown $3,922) and AceVault (Drawdown $791) demonstrate textbook risk control, with their historical maximum drawdowns being almost negligible.- In comparison, Amber Ridge’s drawdown was as high as $340,000, accounting for 87% of its total profit, which means investors experienced extreme volatility that almost “returned profits to zero.”Systemic Strategies’ recent $128,000 retracement also exposed the fragility of its model.
-
The sources of alpha vary: The strategic paths to success vary.AceVault systematically shorts altcoins through high-frequency trading to make profits; Growi HF is an aggressive long hunter, capturing trends under strict risk control; while MC Recovery Fund demonstrates mature long-short balance capabilities and is an “all-weather” strategy.This is a testament to the depth of the Hyperliquid ecosystem, allowing different types of Alpha strategies to coexist.
For investors, there should be more than just APR at face value when evaluating a vault.The true value of a strategy is hidden in the risk management capabilities revealed by its profit and loss factor and maximum drawdown.In the high-volatility, high-leverage arena of Hyperliquid, an asymmetric profit and loss structure is the core to achieving long-term profitability, and extreme risk control is the only path to this victory.