Source: Digital Asset Research, Compiled by: Shaw Bitcoin Vision
Today I’m going to lay out why this situation is one of the rarest we’ve seen in years, and why it has the potential to trigger some of the biggest volatility in the cryptocurrency market in almost five years.
After nearly a year of stagnation, the market is more divided than ever.
In fact, if we count from the day Trump was inaugurated, today, eleven months later, the price of cryptocurrencies is almost stagnant.In other words, so-called “cryptocurrency governments” have no influence on prices.But that’s all about to change.
It’s not often that market sentiment is so polarized as we approach all-time highs.The reason is time.Most people are still tied to the four-year cycle, while the macro cycle is clearly visible.
We have trade wars, physical wars, inflation fears, recession rumors, interest rate cuts, and yet the market remains within striking distance of all-time highs.This is a typical characteristic of adjustments before and after a strong rise.
If you just focused on the headlines, market sentiment and prices, you would think this market is imploding.But the timing suggests otherwise.From Bitcoin, to stocks, to gold, and even to memes, signals across asset classes are converging, and we’re seeing a convergence that hasn’t been seen in more than five years.
Today, I’m going to break down why this matters and what it portends about what’s to come.
Bitcoin and the Wheel of Cycles
Let’s start with Bitcoin and its current 90-day cycle.
We know that the 90-day cycle is extremely important in Gann’s theory because it divides the year into 4 equal parts, thus forming a complete 360-degree cycle.
If we extrapolate back 90 days from the October 17th low, you’ll see that the market has made highs and lows every 90 degrees, all the way back to last year’s October 24th low.
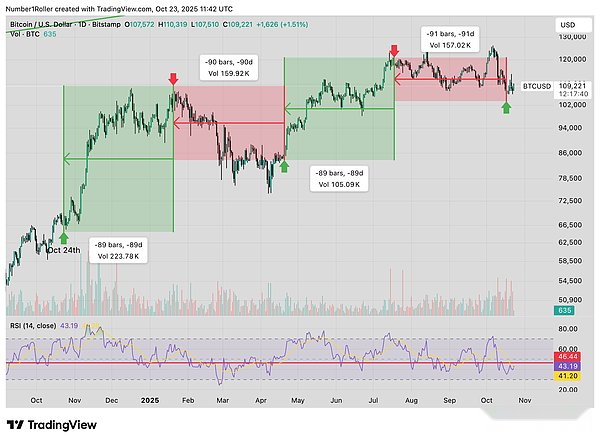
This cycle shows that the 17-day low marks the end of a full cycle that began with the October 24, 2024 low.
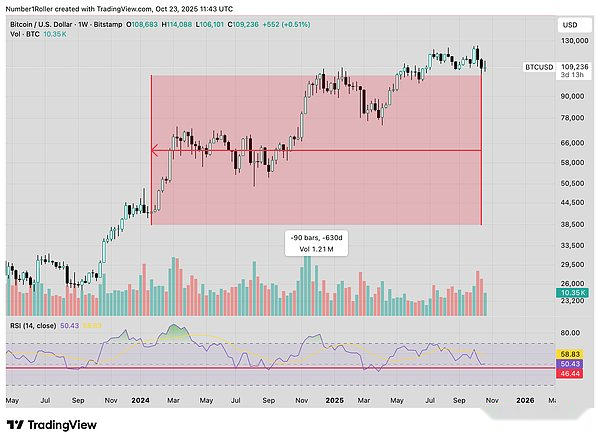
Now we can look at the weekly cycle to see if the 90-day cycle matches the 90-week cycle, and it does.
The weekly low following the January 2024 exchange-traded fund (ETF) launch occurred exactly in the 90th week after October 17, 2025.
Furthermore, this all fits into our 45 degree period, which is half of the 90 degree period and divides the circle into 8 equal parts.
If we look 45 weeks forward and backward from the January 2024 low, we find the banking crisis low in 2023 (135 weeks), and the week before the December 2024 weekly high.Both are important market turning points.
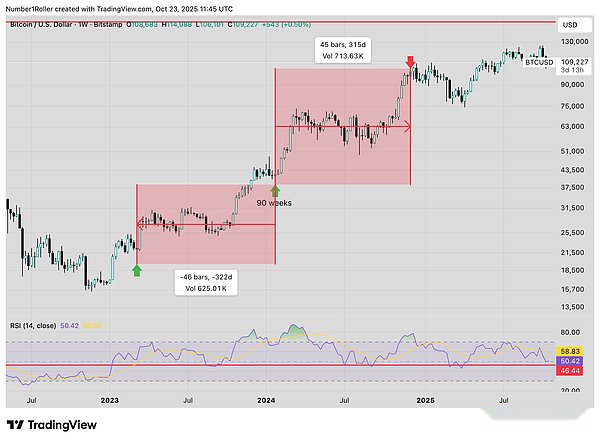
This cycle brought us to today’s low, which is well within these important timing factors.
If it were that simple, the market would give us a clear layout and simple price action leading to these lows.
Unfortunately, it’s not that simple, and the main reason many people get washed out on these critical time factors is that they only focus on price and see what appears to be a collapse in price.
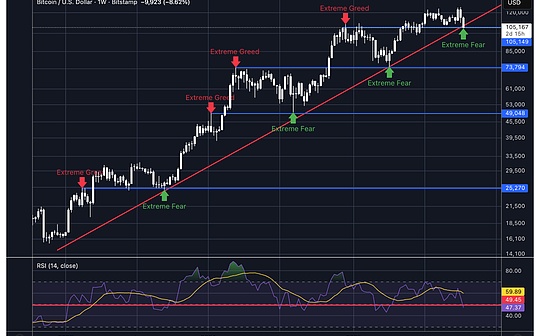
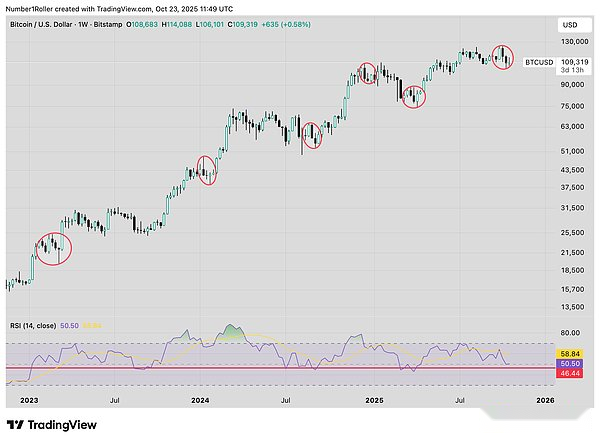
That’s why people call it dishwashing.In the chart below, starting at 30, 45, 60, 90, and 135 points, each of the important weekly time factors resulted in very bad weekly price action designed to scare off market participants.But what happens after these bad weeks?The market reversed higher.
If that’s not enough to convince us that this is a significant low, then we can look further at the monthly chart below, where we can see that a 7-month low-to-low cycle has been in place since the FTX crash bottom.
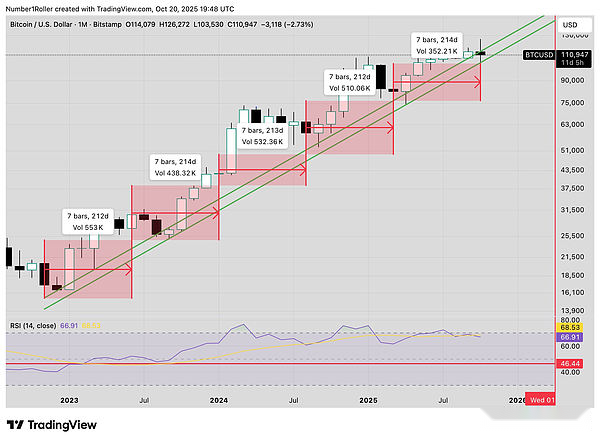
This makes this month the monthly low.
The next chart is a very telling revelation about market psychology.
Every year in this cycle, January’s high prices play an important role.The market always seems to find a way back to where it opened at the beginning of the year to absorb liquidity.This year is no exception.
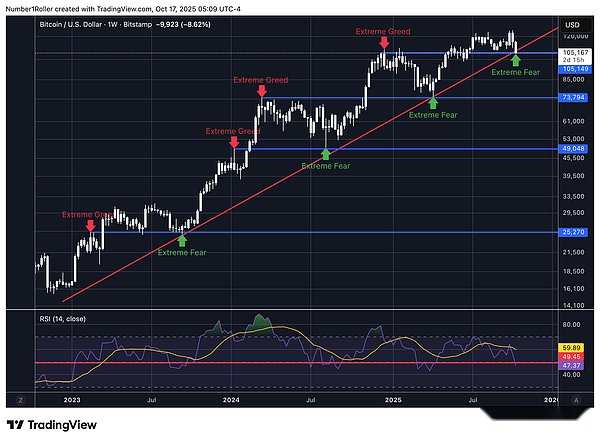
What’s most interesting is that this area reached a state of extreme optimism at the beginning of the year, and then fell into complete panic by the end of the year.
This effectively turns into support, and what was once a price level of greed is now a place of fear.
Looking at the charts and price action, the most similar situations date back to 2023 and 2020.The two years were generally relatively stable, but there were significant fluctuations between the fourth quarter and the second quarter of the following year.
2023 (shown below) was the last time this market moved up and down within the green channel that underpinned this bull run.
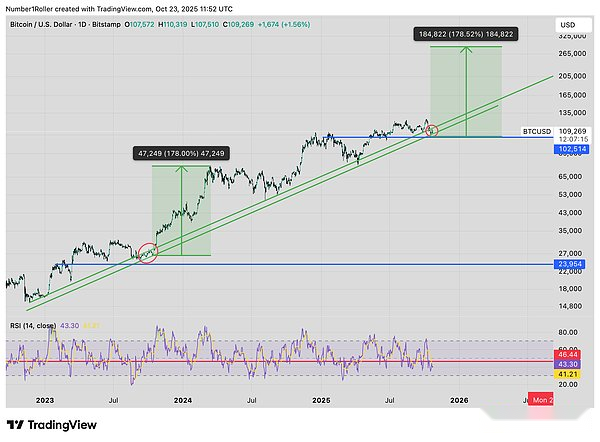
Anyone who lived through that year of trading will tell you that it was psychologically devastating.Things languished that year and seemed to get worse until October, when all hope for a bull market was gone.
The market surged almost 200% to its all-time high, much faster than anyone expected.That’s why I think a similar price shock could happen today.
Finally, we return to 2020, the true five-year cycle we’ve been referring to for months.
People are exhausted and ready to give up, yet we see 2020 playing out exactly the same trends we’ve been watching closely.From January to November, it was flat again.
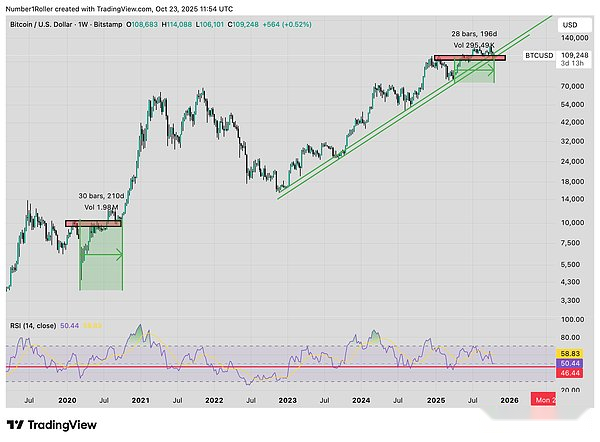
Time has shown that there was a gap of 30 weeks between the COVID-19 plunge and the real start of the rebound.
An eerily similar plunge occurred in April, when markets reset 60 months into the coronavirus pandemic, and are now just 28 weeks old.This suggests that currently everything remains consistent with the repeating rhythm of the 5-year cycle.
In fact, that 30-week period would take us to the first week of November when the real move up would begin, which is when the big moves last year and the year before that started.
Last year Trump was elected on November 4, and markets immediately rallied.A year earlier, ETF-related news broke in early November and the market soared.
So, what news are we betting the market will take advantage of over the next two weeks?
The situation at the end of 2020
Now that we’ve seen Bitcoin cycle, let’s take a step back and look at how the macro picture is leading us toward a 2021-style move.
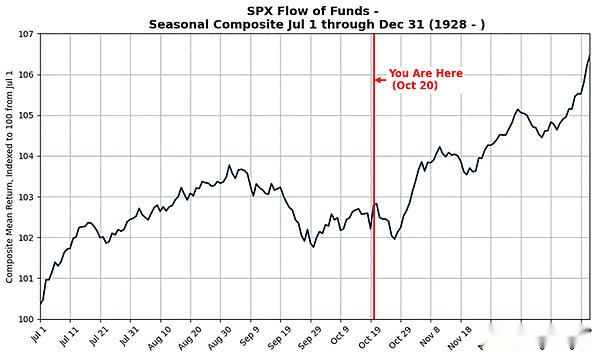
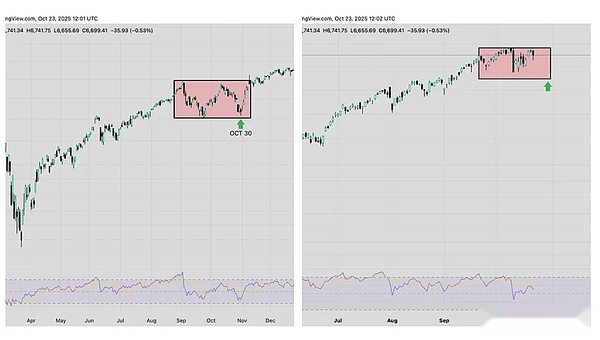
If we start with this simple cycle chart of the S&P (which we’ve been emphasizing all year), you’ll see that September/October went sideways just as our cycle predicted and favored more upside in early November.
People have completely lost their cool about the fourth quarter rally now that we’re a month into it, but they just don’t seem to understand that this has been going on for almost a century.
Looking back at S&P Composite Index charts going back to 1928, we see that year-end rallies typically begin in the last week of October.This will be the case in 2023 and 2024, with the year-end rallies in stocks both beginning in the last week of October.
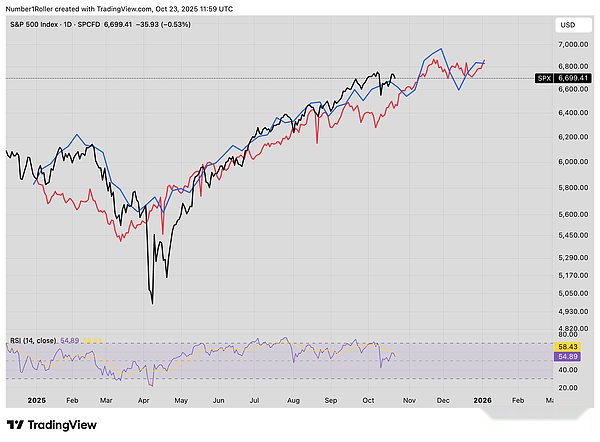
But what was the stock market like in 2020, before the massive cryptocurrency boom?
Then take a look at the comparison below.The left is 2020, and the right is the same period in 2025.The two are extremely similar, to say the least.
Bitcoin vs Gold
It’s not just stocks that have stolen the limelight from cryptocurrencies this year.Gold has also attracted much attention, with people lining the streets to buy it like they did during the 1849 gold rush.
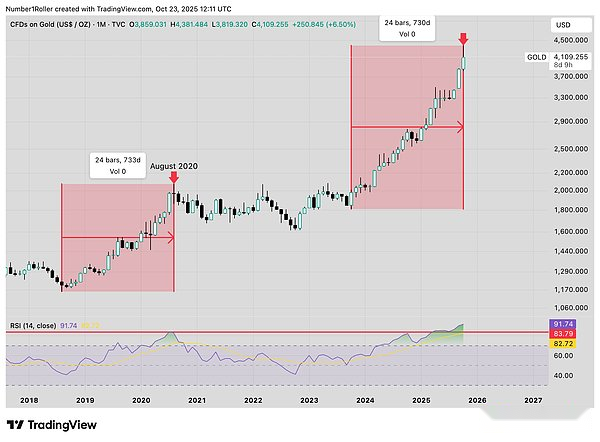
Below we can see how similar the time frame changes are compared to the 2020 gold price rally.It’s exactly 24 months from low to high.I’m not analyzing gold tops or any predictions here, I’m just pointing out that these moves have the exact same time frame from bottom to top.
If we plug these points into a Bitcoin vs. Gold chart, the results look like this.
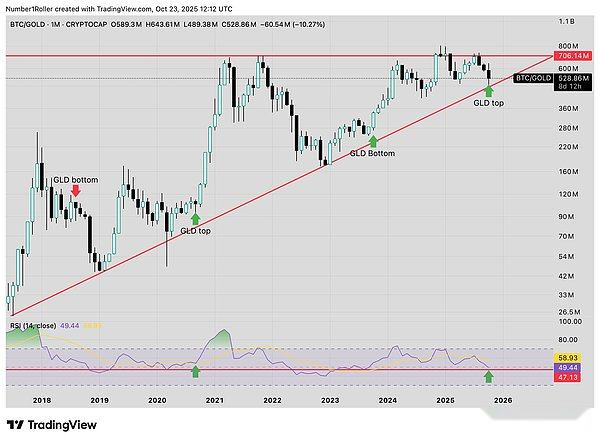
You can see that gold also went through the exact same 24-month rally from the 2020 highs before Bitcoin’s major move.Gold’s rally is now 24 months old, and Bitcoin is at the same point in its cycle on the verge of a major rally.
The resurgence of the MEME craze and IWM

The nail in the coffin for this macro view of the five-year cycle running full tilt is the resurgence of meme stocks and small-cap stocks.
If we look back at GME’s trend from bottoming out in mid-2020 to full-on mania, we’ll see that Meme stocks have followed a very consistent pattern this year.We have been tracking this trend closely due to its correlation with the five-year cycle.
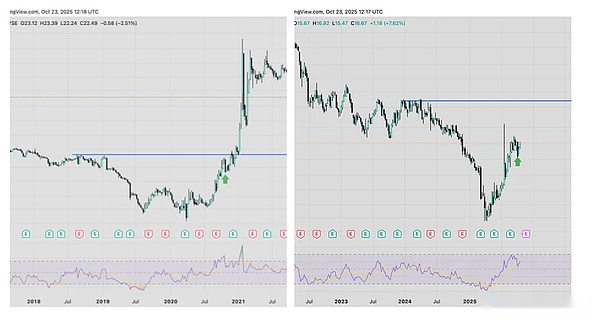
Below is GME for 2020 and KSS today, with the green arrow highlighting the last October low before the parabolic rise.
DORK shares were mostly forgotten about a week after the initial hype, but they have been quietly and steadily rising since then.Stocks like BYND are starting to pop up, which is why I got the above notification from Yahoo Finance the other day.
And, if that wasn’t enough of a sign that market sentiment is improving, Roundhill just relaunched their Meme Stock ETF this month after it hit the highs shortly after launching in late 2021.If the time is accurate, I believe they entered the market early this time.

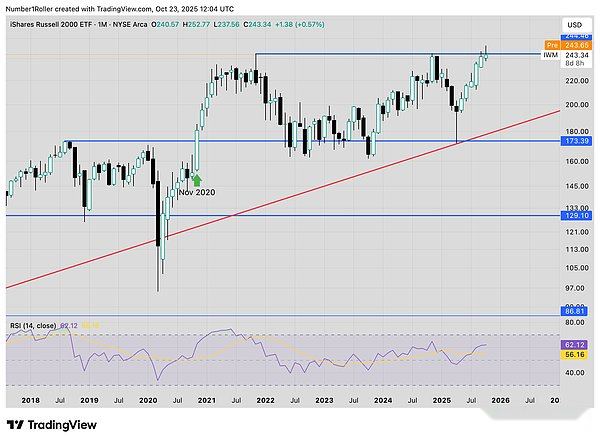
In terms of the current macro landscape, the last thing I want to talk about is IWM.As we all know, the IWM (Russell 2000 ETF) is a signal of rising speculative activity.The last time it had a clear breakout on the monthly chart was five years ago.We haven’t seen a clear breakout and close today, but if time is any guide, we should see it close strongly in November.
Summarize
Major market turning points are always difficult to grasp.We’ve been predicting every turning point in this cycle, and they always push you over the edge.The market always eliminates those participants who are weak-willed and lack confidence before the biggest fluctuations occur.
The current market is no exception.
However, over time, we can see what the market is really trying to tell us.
Considering Bitcoin’s daily, weekly, and monthly cycles, this move appears to be consistent with previous washouts before major moves.
In November 2023, we saw news about ETFs.In November 2024, “Cryptocurrency President” Trump will be elected.So what news will there be in November 2025?
I can’t say for sure, but you can bet it will arrive in about 10 days.
If we just focus on Bitcoin, the potential for a big rally in the short term is pretty good, but when we broaden the view and put it into context with stocks, gold, and risk-on behavior, I really can’t see how this is any different than what we saw at the end of 2020.
This all comes at a perfect time, as the market has been in gridlock for nearly a year, with players giving up.However, if they look at the history, if they look at the timing, they will see that this time is no different.