Author: David Duong (CFA), Global Research Director, Coinbase; Colin Basco, Coinbase Research Assistant; Translation: Bitchain Vision xiaozou
Important points:
We predict that the crypto market will strengthen in the early fourth quarter of 2025, due to sufficient resilient liquidity, favorable macro background and supportive regulatory dynamics, among which Bitcoin is expected to perform outstandingly.
Technical demand for digital asset treasury (DATs) is expected to continue to support the crypto market, even as the industry enters the competitive “player game” stage.
Our research shows that historical monthly seasonal patterns (especially the “September Effect”) are not significant or reliable predictors of crypto market performance.
1, overview
We believe that the crypto bull market still has room for continued space at the beginning of the fourth quarter of 2025, with the main driving forces including a resilient liquidity environment, favorable macro background and supportive regulatory dynamics.We believe that Bitcoin is particularly expected to continue to surpass market expectations because it directly benefits from existing macro tailwinds.In other words, unless energy prices fluctuate dramatically (or other factors that may negatively affect inflation trends), the current immediate risks that interfere with the path of US monetary policy are actually quite low.At the same time, the technical demand for digital asset treasury (DATs) should continue to provide strong support for the crypto market.
However, seasonal doubts continue to plague the crypto space—Bitcoin has historically declined against the dollar for six consecutive years between 2017 and 2022.Although this trend has led many investors to believe that seasonal factors significantly affect crypto market performance, the assumption has been falsified in 2023 and 2024.In fact, our study shows that the sample size is too small and the possible distribution of results is limited by the statistical significance of such seasonal indicators.
The more critical question for the crypto market is: Are we in the early or late stages of the DAT cycle?As of September 10, public DATs held more than 1 million BTC ($110 billion), 4.9 million ETH ($21.3 billion) and 8.9 million SOL ($1.8 billion), and late-stage entrants have begun to target alternatives to the risk curve further downstream.We believe that it is currently in the “Player Game” (PvP) stage of the cycle, which will continue to drive funds to large crypto assets.But this is also very likely to indicate a sign that small DAT participants are about to enter the integration phase.
2, the prospects are still optimistic
At the beginning of the year, we proposed that the crypto market will bottom out in the first half of 2025 and hit an all-time high in the second half of 2025.This was a departure from market consensus at the time – at that time, market participants were worried about the potential recession, questioning whether the price increase meant that the market surged irrationally, and worried about the sustainability of any recovery.But we found that these views were misleading, so we should return to our unique macro perspective.
Entering the fourth quarter, we maintain an optimistic outlook for the crypto market and expect to continue to receive support from strong liquidity, favorable macroeconomic environment and encouraging regulatory progress.In terms of monetary policy, we expect the Fed to implement interest rate cuts on September 17 and October 29 as the U.S. labor market has provided strong evidence of weakness.We believe that this will not only not form a local vertex, but will instead activate the off-site wait-and-see funds.In fact, we pointed out in August that a drop in interest rates could prompt an important component of $7.4 trillion in money market funds to end the wait-and-see state.
Nevertheless, a significant shift in the current inflation trajectory (such as rising energy prices) will pose a risk to this outlook.(Note: We believe that the actual risks posed by tariffs are much lower than some opinions have assessed.) But OPEC+ has recently agreed to increase oil production again, and global oil demand is showing signs of slowing down.However, the prospect of imposing more sanctions on Russia could also push up oil prices.Currently we do not expect oil prices to break through the threshold that puts the economic situation into the stagflation range.
3,DATThe cycle is maturing
On the other hand, we believe in digital assetsfiscalLibrary(DATs) technology demand is expected to continue to support the crypto market.In fact, the DAT phenomenon has reached a critical turning point.We are neither in the early adoption stage of the characteristics of the past 6-9 months nor are we considered to be nearing the end of the cycle.In fact, we have entered the so-called “player game” (PvP) stage – a competitive stage, and success is increasingly determined by execution, differentiated strategies and timing, rather than simply copying MicroStrategy’s operating model.
Indeed, early actors such as MicroStrategy have enjoyed a significant premium to net asset value (NAV), but competitive pressure, execution risks and regulatory constraints have led to the compression of mNAV (market value ratio relative to net asset value).We believe that the scarcity premium that early adopters benefit has dissipated.Despite this, Bitcoin-focused DATs currently hold more than 1 million BTC, accounting for about 5% of the token’s circulating supply.Similarly, top ETH-focused DATs hold a total of approximately 4.9 million ETH (US$21.3 billion), accounting for more than 4% of the total ETH circulation supply.
picture1. ETHSpecial digital assetsfiscalThe library continues to accelerate its purchase trend
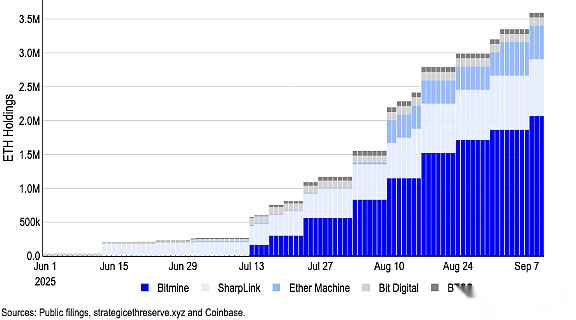
In August, the Financial Times reported that 154 U.S. listed companies have raised about $98.4 billion in crypto asset acquisitions in 2025, a significant increase from the $33.6 billion raised by the top 10 companies this year (based on Architect Partners data).Capital investment in other tokens is also growing, especially SOL and other alternative tokens.(Forward Industries recently raised $1.65 billion to form a SOL-based digital asset treasury, powered by Galaxy Digital, Jump Crypto and Multicoin Capital.)
This growth has sparked more scrutiny.In fact, recent reports indicate that Nasdaq is strengthening its supervision of DATs, requiring specific transactions to be approved by shareholders and advocating for enhanced information disclosure.However, Nasdaq clarified that it did not targetDATsThe new rules release any official press release.
At present, we believe that the DAT cycle is maturing, but it is neither early nor late.It is certain that in our opinion, the era of easy profit and guaranteeing mNAV premium is over—in this PvP stage, only the most disciplined and strategically arranged participants can thrive.We expect the crypto market to continue to benefit from unprecedented capital inflows from these carriers, thereby improving returns performance.
3, Does seasonal risks really exist?
Meanwhile, seasonal fluctuations are a concern for crypto market participants.Bitcoin fell against the US dollar for six consecutive years between 2017 and 2022, with an average negative yield of 3% over the past decade.This leaves many investors with the impression that seasonal factors seriously affect crypto market performance, and September is usually an unfavorable time to hold risky assets.However, if transactions are conducted based on this assumption, they will be falsified in 2023 and 2024.
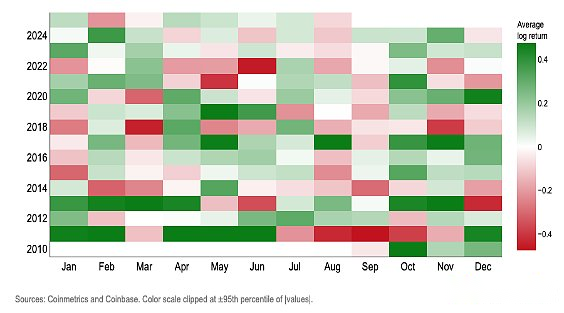
In fact, we believe that monthly seasonal volatility is not an effective trading signal for Bitcoin.Through various methods such as frequency distribution graph, logical odds ratio, off-sample score, placebo test and control variables, the conclusions are consistent: the annual month is not a statistically reliable predictor of positive and negative values of BTC’s monthly log-return rate.(Note: We use logarithmic yields to measure geometric or compound growth because it better reflects long-term trends and takes into account the higher volatility of Bitcoin.)
picture2.Bitcoin monthly logarithmic yield heatmap
The following tests found“Calendar month“For predicting the positive and negative values of the monthly logarithmic yield of Bitcoin are unreliable:
(1) Wilson confidence interval
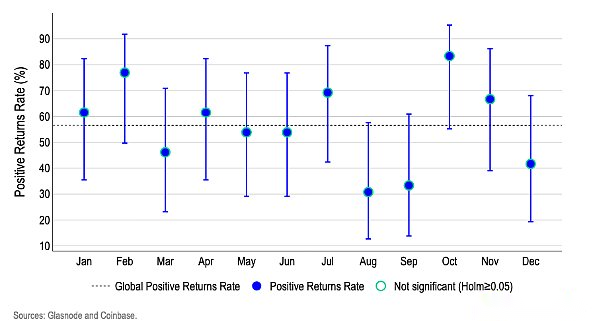
Figure 3 shows that no month can break through the obvious threshold for predicting seasonality after considering small sample uncertainty.Months that seem to be “high” (February/October) or “low” (August/September) have a range of errors overlapping with the overall average and other months, representing random variance rather than a persistent calendar effect.
Each dot shows the proportion of the probability that BTC will end above that month; the vertical line/bar chart represents the 95% Wilson confidence interval band—a proper measure when there are only about 12-13 data points per month, as it provides a more accurate threshold for uncertainty for small samples.
The dotted line shows the average overall probability of rising.Since we simultaneously examined the 12-month data, we adopted the Holme multiple test adjustment method to avoid a lucky month disguising as a regular pattern.
picture3. BTCPositive logarithmic yield and95%Wilson confidence interval
(2) Logistic regression analysis
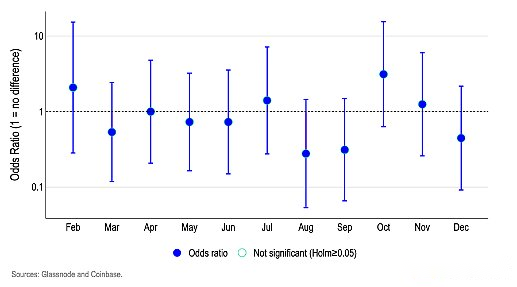
We used a logistic regression model to test the effect of a specific month on the probability of Bitcoin’s rise and fall (based on January).Figure 4 shows that the odds ratios of each month are mostly concentrated around 1.0, and the key is that their 95% confidence intervals cross the 1.0 boundary.
A value close to 1.0 means “the same probability as January’s positive log-return rate”, higher than 1.0 means “higher probability”, and lower than 1.0 means “lower probability”.
For example, odds ratio 1.5 means “the probability of a rising month is about 50% higher than that of January”, while 0.7 means “the probability is about 30% lower.”
Since most confidence intervals span 1.0 and no month is significant after being adjusted for Homm multiple tests, we cannot identify calendar months as a valid indicator of positive and negative values of Bitcoin’s logarithmic yields.
Figure 4. Logistic regression—Probability ratio of monthly BTC log-return positive and negative value versus January (benchmark)
(3) Out-of-sample prediction
In each step, we re-estimate only two models using data available up to that month (the initial stage is trained with half of the dataset):
The benchmark model is a logical model that only contains intercept terms, which predicts only a constant probability (equal to the benchmark rate of the proportion of positive earnings months since history).
The Month Effect (MoY) model is a logistic regression containing month dummies; it predicts the probability of a rising month in the current calendar month based on past performance of that month.
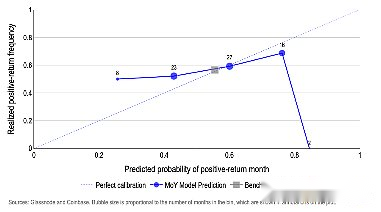
Our results are presented in Figure 5, where the X-axis represents the predicted probability of a positive log-return month and the Y-axis represents the proportion of months in which positive returns are actually achieved.When drawing prediction results, the perfectly calibrated model data points should be distributed along the 45° line – for example, when predicting the 50% rise probability, the actual increase month accounts for exactly 50%.
There is a significant deviation in the Month Effect (MoY) model.For example:
When the predicted probability of rising is about 27%, the actual frequency of realization is about 50% (overly pessimistic);
Only roughly close to the target within the 45-60% forecast range;
Overconfidence is achieved in high probability intervals—for example, about 75% of the predictions correspond to about 70% of the realized values, while about 85% of the extreme interval predictions achieve about 0%.
By contrast, the historical benchmark rate is always predicted (about55-57%Probability of rise)’s benchmark model is close to the 45° line, and given that Bitcoin’s historically positive earning months probability has been relatively stable, the line hardly moves.In short, this result shows that calendar months have little predictive power in off-sample predictions.
picture5: Month effect (MoY) Out-of-sample prediction accuracy of logistic regression model
(4) Randomized placebo test
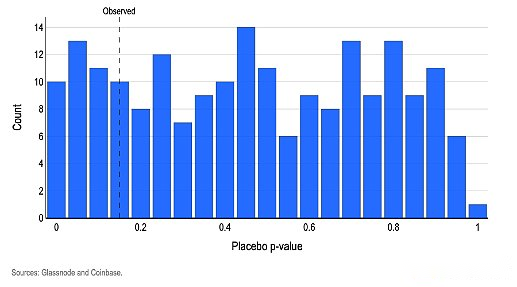
To verify whether the “month label” helps predict positive and negative logarithmic yields, we adopt a simple logical model with month dummy variables and use a holistic test to determine whether these variables improve the fit degree compared to the benchmark model without month (the standard likelihood ratio joint test).The observed p-value is 0.15, meaning that even if the month factor is irrelevant, the probability of at least such a significant pattern occurring by chance alone is about 15%.We then randomly disrupted the month labels thousands of times, re-exerting the same joint test each time.
The results show that about 19% of random disruption operations produce results that are less than or equal to the observed p-value (Figure 6).
In short, this result is very common in purely random conditions, which reinforces the conclusion that “there is no month signal.”If the month label is statistically significant, the joint test of real data should present a p-value <0.05, and the proportion of such a small p-value generated in the disruption operation should be less than 5%.
picture6.Random disruption in the logical model“month“Placebo produced by labelspValue distribution
(5) Control variable test
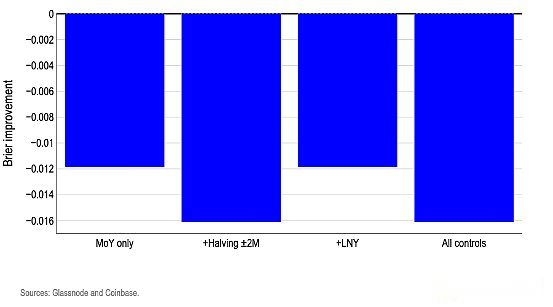
Adding a realistic calendar logo does not unlock the tradable advantage—and often leads to a decrease in the accuracy of forecasting of rising and falling directions.We used the same month virtual variable to re-estimate the “positive return month probability”, and then superimpose the practical control variables of two major events: 1) may affect the logarithmic yield of Bitcoin; 2) the month that occurs every year is not fixed – Lunar New Year and Bitcoin halving window (±2 months).We only use control variables corresponding to different calendar months each year to avoid redundant dummies causing instability in model estimation.
This test is intended to verify two common concerns: (i) phenomena that appear to be “month effects” may be just a disguise of periodic events—such as the Lunar New Year (LNY) liquidity or the Bitcoin halving effect; (ii) even if the original month pattern is weak, it may be effective after considering these drivers.In the initial stage, we trained with half of the dataset and half for testing.useBrierRating Assessment Monthly Probability Forecast, this score reflects the average squared error between the predicted probability and the actual increase and fall results (i.e. the degree of deviation between the predicted value and the reality).
In Figure 7, the bar chart shows the Brier improvement values for each model compared to a simple benchmark (using only a single value of the historical upward rate in the training window).All cylinders are below zero, meaning that each control variable variant performs worse than the constant probability benchmark.In short, introducing additional calendar logos on the basis of month labels only adds noise.
picture7: Add logistic regression model of control variables in out-of-sample predictionBrierImproved ratings
4,in conclusion
The market seasonal conception has harmful shackles on the investor’s mind and may form self-fulfilling prophecies.However, our model shows that simply assuming monthly fluctuations are basically consistent with the long-term historical average, it is better than all calendar-based trading strategies.This strongly implies that the calendar pattern does not contain valid information to predict the monthly direction of Bitcoin.Since calendar months cannot reliably predict the positive and negative direction of logarithmic yields, the possibility of predicting the yield amplitude is even slim.Synchronous decline in September in previous years and even Bitcoin“Soaring October“The legendary increase may be statistically interesting, but none of them are statistically significant.