Source: Coinbase; Compiled by: Bitcoin Vision
There are no easy answers after too much leverage
Currently, multiple institutions are trying to decipher the events that led to the cryptocurrency market’s collapse on October 11, which wiped out more than $19 billion in leveraged positions.Therefore, we will not go into too much detail about the how, what, when and why of events, or simply to correct any misunderstandings about the sequence of events.However, we are more concerned about how this plunge has affected the current state of the cryptocurrency market.
While the immediate catalyst was a tweet from President Trump announcing 100% tariffs on Chinese imports, there were several factors that brought this incident to such serious proportions.These factors include excessive leverage, fragmentation of liquidity across exchanges, and the rise of cross-margin collateral—all of which mask the overall risk taken by many large cryptocurrency traders.
Indeed, we believe that market concepts such as price convexity are difficult to understand (or at least not intuitive) for most market participants, but the additional challenge of thinly traded altcoin markets also leads to poor risk management.Additionally, platforms are now far more interconnected than ever before, which can have unintended consequences for transactions.
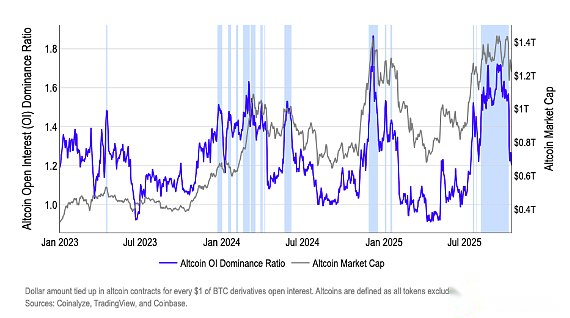
It’s difficult to pinpoint exactly how much leverage is being flushed out of the system, but below we express it using the ratio of total open interest in perpetual futures and options across platforms (including centralized exchanges like Binance and Deribit and decentralized exchanges like Hyperliquid) relative to the total market cap of cryptocurrencies excluding stablecoins.
Figure 1. System Leverage Recorded One of the Largest Liquidations in Cryptocurrency History
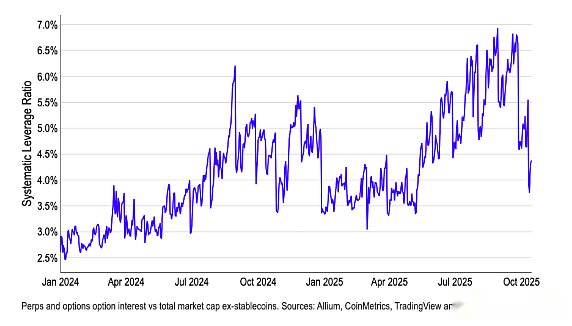
This system leverage ratio tells us that before the wave of liquidations broke out, the pure speculative exposure to the cryptocurrency market (i.e. only counting directional bets, excluding hedging) was close to 7%.That said, since the beginning of May we have seen systemic leverage increase, with derivatives exposure nearly doubling relative to cryptocurrency market capitalization.The sharp decline on October 11 (see Figure 1) reflected a massive deleveraging to levels below 4%, with a slight recovery this week – now back to levels seen at the start of the year.
Our view:The steady climb in leverage earlier this year exemplified the procyclical nature of leverage in the cryptocurrency space, as speculative positioning grew faster than the market capitalization of the underlying cryptocurrencies, exacerbating market vulnerabilities.On the other hand, the chart does a good job of showing how the market can return to structurally healthier leverage levels after a “cleanup,” perhaps setting the stage for a potential rally.Even so, the timing remains highly uncertain.
As we noted in our October Positioning Report, the altcoin open interest to open interest ratio is above the danger line of 1.4, a level that has preceded past waves of liquidations — a cause for alarm.After the leverage spike on October 11, the ratio eventually reset to around 1.2.We believe this reduces the likelihood of another near-term plunge, but does not necessarily herald a Bitcoin rebound;From here on out, as the volatility from liquidation gradually subsides,Price action may depend more on macro and global liquidity.
Figure 2. Altcoin’s ratio of open contract volume dominance returns to the danger zone
behind
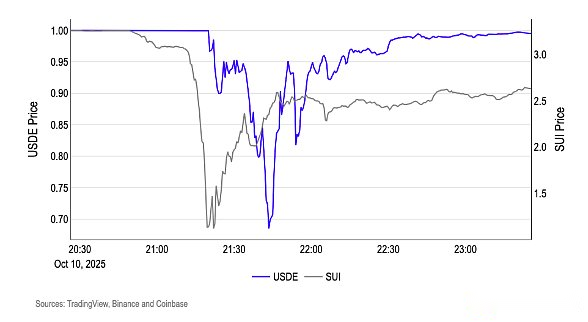
One theory circulating on social media suggests that the drop in USDe (Ethena’s synthetic stablecoin) on the Binance platform may have triggered a series of liquidations; however, we believe this theory does not accurately reflect the correct sequence of events.The fact that altcoins were the first to sell off—cryptocurrencies like SUI hit intraday lows before USDe fell below $1 on Binance—means that the market liquidity shock has already begun (Chart 3).After the tariff news was announced, market makers pulled quotes lower, depth disappeared, and weak order books left gaps for sell orders.The initial vacuum triggered forced liquidations of major currencies and altcoins alike.Only then did the pressure spread to “stablecoins.”
USDe’s discount appears to be driven by DeFi platforms.In other words, Binance’s USDe decoupling was not a protocol solvency issue, but occurred after a chain reaction occurred.The largest declines (about $0.65) were concentrated on Binance, while USDe prices on major DeFi platforms were closer to face value and redemption functions remained normal.
In our opinion, the most plausible reason for this discrepancy is the stress on the exchange pipeline: as the size at the top of the order book evaporates and the internal pricing/oracle logic relies heavily on its own order book, the spot value of USDe on the venue falls further and is transmitted to the margin/borrowing system, deepening the local discount.
Our view:USDe re-pegged (on Binance and other platforms) within hours as liquidity providers returned and spreads normalized – behavior consistent with a temporary liquidity vacuum rather than a collateral failure.
Figure 3. USDe decoupling after altcoin liquidation