Source: Bitcoin Magazine; Compilation: Wuzhu, Bitcoin Chain Vision
Bitcoin’s journey in 2025 has not brought about the explosive bull market soaring that many people expect.After reaching a peak of more than $100,000, the Bitcoin price plummeted to a low of $75,000 in 2025, sparking debate among investors and analysts about where we are in the Bitcoin cycle.In this analysis, we exclude interference and use on-chain indicators and macro data to determine whether the Bitcoin bull market remains intact or whether there will be a deeper bitcoin callback in the third quarter of 2025.Key indicators such as MVRV Z score, value destruction days (VDD) and Bitcoin capital flows provide key insights into the market’s next move.
Is Bitcoin’s 2025 a healthy pullback or the end of a bull cycle?
An important starting point for evaluating the 2025 Bitcoin cycle is the MVRV Z score, a trusted on-chain metric used to compare market value with realised value.After Bitcoin reached 3.36 when it peaked at $100,000, the MVRV Z score fell to 1.43, consistent with the 2025 trend of Bitcoin’s price dropping from $100,000 to $75,000.Bitcoin’s 30% callback may seem worrying, but recent data shows that the MVRV Z score rebounded from its 2025 low of 1.43.
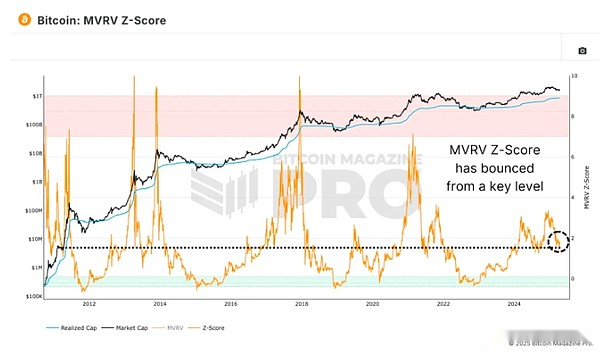
Figure 1: MVRV Z score reflects potential local bottoms in the 2025 Bitcoin cycle.
Historically, in previous Bitcoin bull markets (such as 2017 and 2021), the MVRV Z score level was about 1.43, marking a local bottom, not the top.Bitcoin’s pullbacks usually precede the recovery of the uptrend, indicating that the current adjustment is consistent with a healthy bull cycle dynamic.Although investor confidence has been shaken, the move is in line with the historical pattern of the Bitcoin market cycle.
How smart money shapes the Bitcoin bull market in 2025
Another key on-chain metric is the value-destruction days (VDD) multiple, which tracks BTC transaction speeds weighted by holding periods.The surge in VDD shows that experienced holders are taking profits, while lows indicate that Bitcoin is accumulating.Currently, VDD is in a “green area”, similar to the level in the late bear market or the early stage of a bull market recovery.
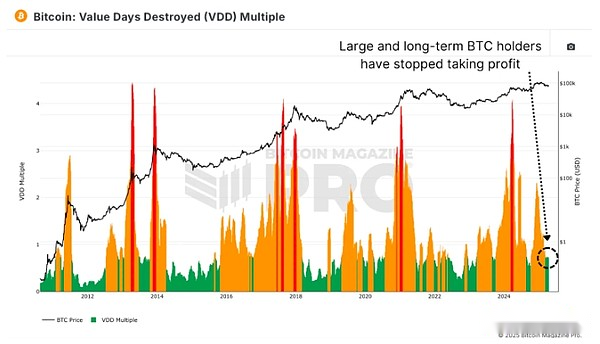
Figure 2: VDD multiple highlights the long-term accumulation of Bitcoin in 2025.
Following Bitcoin’s decline from $100,000, the low VDD indicates the end of the profit-taking phase, with long-term holders accumulating funds, and Bitcoin prices are expected to be higher in 2025.The Bitcoin Cycle Capital Flow Chart further clarifies this trend, breaking down the realized capital by currency age.Near the $106,000 peak, new market entrants (<1 month) drove a surge in activity, indicating that FOMO drives buying.Since the Bitcoin pullback, the activity of the group has cooled to typical levels in the early to mid-term bull market.
In contrast, activity among groups holding for 1-2 years, often macro-savvy Bitcoin investors, is increasing and accumulating at lower prices.This shift reflects the accumulation pattern of Bitcoin in 2020 and 2021, where long-term holders buy when prices fall, laying the foundation for a rebound in the bull cycle.
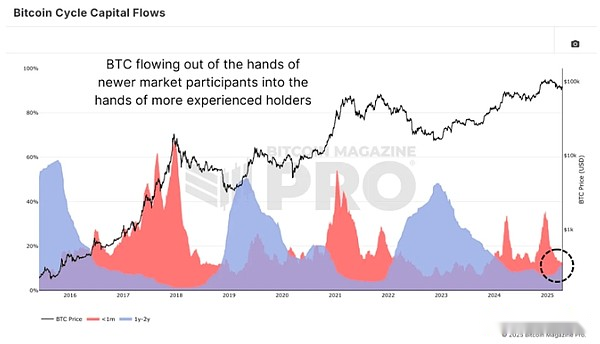
Figure 3: Bitcoin’s cyclical capital flows show that BTC will flow to experienced holders in 2025.
Where are we in the Bitcoin market cycle in 2025?
To enlarge, the Bitcoin market cycle can be divided into three stages:
-
Bear market stage:Bitcoin deep callback 70-90%.
-
Recovery phase:Recovering its previous all-time highest level.
-
Bull market/index stage:Bitcoin price is rising parabolicly.
The past bear market (2015, 2018) lasted for 13-14 months, while the most recent Bitcoin bear market also lasted for 14 months.The recovery phase usually lasts 23 to 26 months, and the current 2025 Bitcoin cycle is within this range.However, unlike previous bull markets, Bitcoin has a pullback after breaking through its previous high instead of soaring immediately.
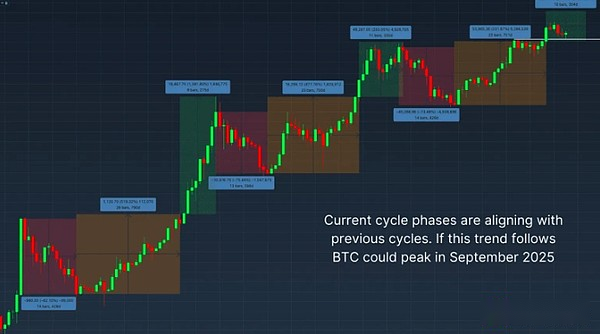
Figure 4: Historical Bitcoin Cycle Trend Forecast The peak of bull market in the third quarter of 2025.
Bitcoin’s pullback may herald higher lows, laying the foundation for the index phase of the 2025 bull market.Based on the 9-11-month index phase of the past cycle, assuming the bull cycle resumes, Bitcoin price may peak around September 2025.
Macro risks affecting Bitcoin price in the third quarter of 2025
Although the on-chain indicators are bullish,Macro headwinds pose risks to Bitcoin prices in 2025.The S&P 500 Index’s correlation with Bitcoin shows that Bitcoin is still closely related to the U.S. stock market.As concerns about a global recession grow intensify, weakness in traditional markets may limit Bitcoin’s short-term upside potential.
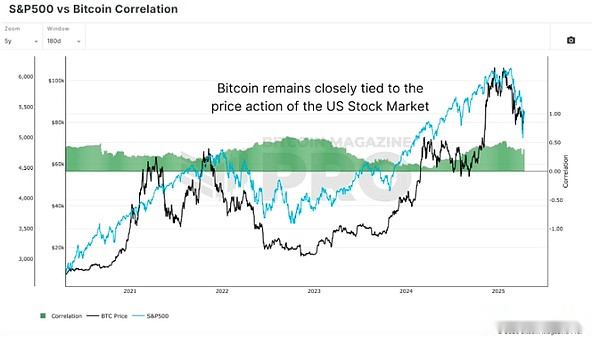
Figure 5: The correlation between Bitcoin and the US dollar.
Monitoring these macro risks is crucial because even if the on-chain data is still supported,Deteriorating stock markets could also trigger deeper adjustments to Bitcoin in the third quarter of 2025.
Conclusion: Bitcoin’s third quarter outlook for 2025
Key on-chain indicators – MVRV Z score, value destruction days and Bitcoin cycle capital flows –Indicates that there is healthy, cyclical consistent behavior and long-term holder accumulation in the 2025 Bitcoin cycle.Although the speed is slower and uneven compared to the past bull market, the current cycle is consistent with the historical Bitcoin market cycle structure.If macro conditions stabilize, Bitcoin appears to have another rise and may peak in the third or fourth quarter of 2025.
However, macro risks, including stock market volatility and recession concerns, are still worthy of attention.