
Press: The first 100% Solana pledged ETF will be listed on the New York Stock Exchange on the evening of the 28th. What impact will this have on the price of SOL?Bitwise did research and compiled the BitChain Vision, as follows:
Main points
-
Under simplified assumptions of today’s market conditions, assuming current inflows remain constant with the price multiplier (1.5x), thenA net inflow of US$1 billion will correspond to an increase in SOL prices of approximately 34%.
-
We expect that as assets become institutionalized, the relationship between financial flows and price behavior will strengthen.
-
Previous spot cryptocurrency ETFs have historically been “sell the news” events.
introduction
The United States approved spot BTC and ETH ETFs on January 11, 2024, and July 24, 2024, respectively, which is undoubtedly historic.These events signaled a sea change in the legitimacy of cryptocurrencies as portfolio assets, accelerating institutional investor adoption and cementing digital assets as a mainstream financial component.
While Europe has long been more open to cryptocurrency exchange-traded products (ETPs), the United States has lagged behind under regulators like Jay Clayton and Gary Gensler, which can be said to be disruptive and political.Clayton is a conservative skeptic, while Gensler brings his “crypto-savvy” expertise to the adversarial fight.After facing legal losses and reputational damage, the U.S. Securities and Exchange Commission (SEC) approved both assets, representing the final green light from the regulator.
The application for the Solana ETF follows the path set by the spot Bitcoin and Ethereum ETFs, using the same commodity-based trust share framework and relying on monitoring sharing arrangements associated with CME Solana futures.
SOL is the sixth largest cryptocurrency by market cap (~$110 billion), but its CME futures market is more liquid and larger than its closest competitor XRP (fifth largest by market capitalization; ~$157 billion) at >$100 million per day, averaging $266 million per day in July 2025.SOL’s CME futures market should be enough to quell the SEC’s concerns about “manipulation of large-scale unregulated markets.”
Previously, the general listing standards were introduced, allowing companies that meet the standards to issue funds in a “one-click” manner.This doesn’t necessarily automatically drive asset development, butLiterally taking the crypto asset from “a little-known currency tied to a wallet on the blockchain” to “a stock ticker that anyone can access through a brokerage account”.This will set the stage for the asset to rise when fundamentals and market sentiment converge with traditional finance (Trad-Fi).
This article aims to interpret whether the listing of SOL ETF will have an impact on the price of SOL.
SEC Approval Is a “Selling News” Event
These post-approval price movements suggest that while the launch of the ETF is a positive long-term positive, it could become a “news sell-off” event in the short term.Both assets traded lower before reversing higher within about two weeks of the approval.
-
BTC Approval (January 2024): BTC has risen approximately 1.75x in the 90 days leading up to the approval, as the market has already priced in the impact of the approval and BTC is trading with strong momentum as it enters the second year of its 4-year cycle.This pullback is a classic example of profit-taking following a strong signaling event.
-
ETH Approval (July 2024): Ethereum’s price action has been chaotic, trading sideways ahead of approval.The market was less certain about the impact of the ETH ETF, in part because inflows into the BTC ETF were still relatively small at the time, leading to uncertainty about whether the ETF could structurally change demand.
BTC and ETH price performance before and after spot ETF approval
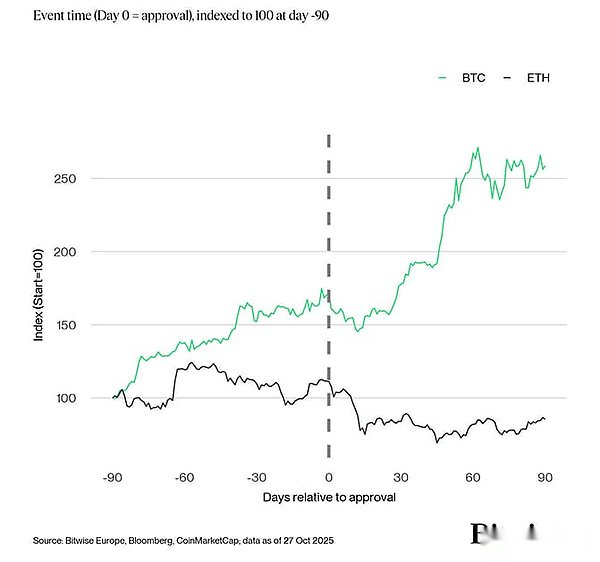
Both assets ultimately benefited from ETF approval, but the initial reaction reflected that the market had jumped the gun.
History does not repeat, but it always rhymes
If history is any guide, SOL’s ETF is likely to follow a similar path upon approval: a short-term decline or lackluster reaction, followed by long-term structural support.This approval has been widely discussed and anticipated, so it’s unlikely to come as a complete surprise, especially if there’s already an ETF approved.
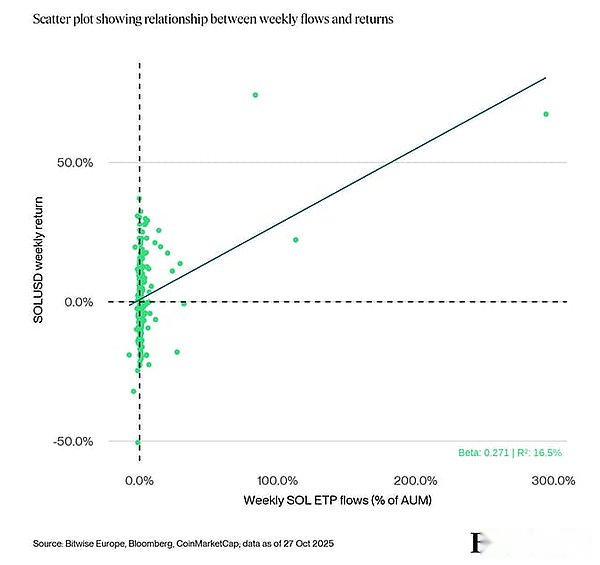
The relationship between SOL ETP flows (as % of AUM) and SOL returns shows an average beta of 0.269, which means that on average, a 1% inflow into SOL ETP (relative to AUM) is associated with a +0.269% move in SOL’s weekly returns.
But R² is only about 16.5%, which means that money flows explain less than one-fifth of the variation in overall returns for the entire sample of observations.In other words, while there is a directional relationship, it is likely that most of SOL’s price movements are primarily driven by factors outside the scope of this analysis.
Most of the data points are tightly clustered around zero flow, with only a few extreme weeks (outliers, flow rates reaching 50% to 300%) causing the regression line to shift upward.This suggests that the relationship is primarily affected by large ETP traffic events rather than “normal” weeks.
Our sample size consists of 13 SOL stocks, ranging from 1041 days for VSOL SW Equity (September 21, 2021) to 82 days for SSK US Equity (i.e. the first SOL pledge ETF).Net funds flow data is aggregated by the number of weeks since each stock’s inception.
SOL Weekly Returns vs SOL ETP Weekly Traffic (% of AUM)
Solana ETP traffic is growing but remains on the back burner
Inflows into global Solana ETPs have grown dramatically since Q4 2024, and particularly over the past few months, with total assets under management (AUM) now standing at approximately $3.9 billion.This represents significant traction among institutional investors, but is still small relative to Bitcoin and Ethereum.
In the fourth quarter of 2024, on the eve of Trump’s election victory, Solana performed well and became the preferred blockchain for meme currency issuance.The meme coin issuance platform that defines this cycle, Pump.fun, is built on Solana’s leading DEX Raydium.At the peak of retail participation, Solana accounted for nearly 90% of all DEX trading volume.Meme coins account for a significant portion of transaction volume, and Solana’s ecosystem benefits greatly from this.While ETP flows contribute, they are not the dominant driver.
even thoughAt current levels, inflows also explain SOL price movements more than ever before (rising to ~20% by 2025), but retail dynamics still dominate.There are two main reasons:
1.SOL remains a retail-led asset.It has been the base layer for the meme coin craze, with a large portion of its trading volume tied to token issuance platforms.
2. From an absolute value perspective, the scale of institutional capital inflows is small.With ETP AUM totaling approximately $3.9 billion, SOL remains a high-beta, high-risk asset that sits high on the risk curve of traditional financial portfolios.Institutional investors are involved, but not yet on a large scale.
Cross-asset correlation matrix
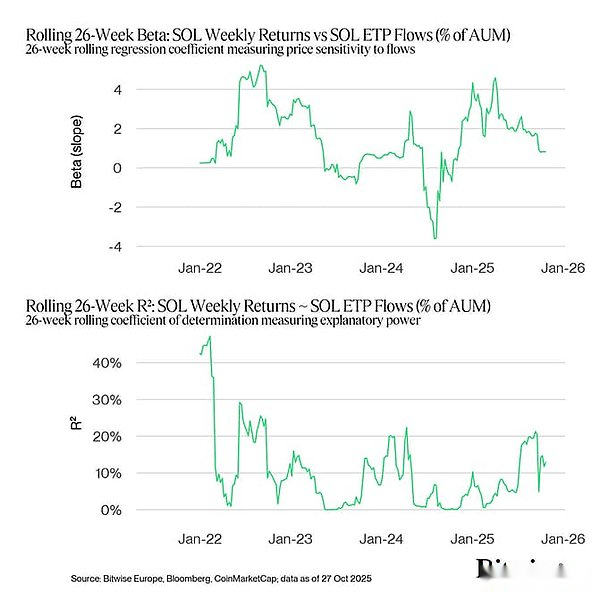
In the early days of the bear market (2022), rolling R² soared above 40% and beta remained positive.This reflects periods when redemptions and price declines occur simultaneously – flows and returns are closely linked, with betas showing positive values over the same period as both are driven by forced selling or capitulation.In the first six months of 2022, prices fell by about 77%.
As the bear market entered 2023, prices fell again by about 77% at the end of the year, beta approached zero and sometimes became negative, and R² fell to extremely low levels.This suggests that inflows tend to be “sticky” or counter-trend – investors will still enter a weak market on average even if prices continue to fall.During this phase, inflows increase while returns decrease, resulting in a negative beta.Market behavior is dominated more by external shocks (such as the FTX crash and widespread liquidity stress) than by ETP inflows.
In contrast, the 2024-25 bull market presents a different picture.The beta coefficient is roughly positive, and the R² value is in the 10%-20% range.At this time, capital flow tends to chase and amplify the upside: new funds and new allocations strengthen the upward momentum. Although capital flow is not the only driver of performance, in periods when the beta coefficient is high and the R² value is not low, capital flow is closely related to price.Occasional spikes in negative beta during this period are typically associated with pullbacks or market rebalancing events, such as new money chasing the gains of a previous rally, or redemptions during short-term pullbacks.
How net capital inflows affect prices
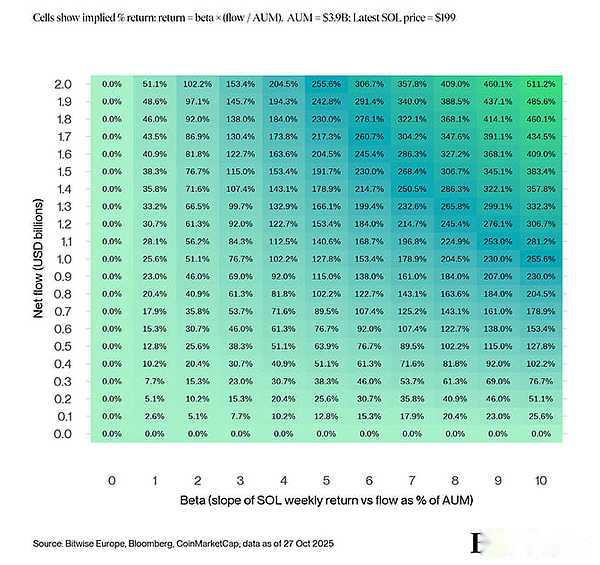
Under simplifying assumptions about today’s market conditions,Assuming the current flow-to-price multiplier (1.5x) remains unchanged, a $1 billion net ETF inflow would correspond to a price increase of approximately 38%.
Note that this sensitivity table is purely simultaneous, it does not introduce any uncertainty (either R² or confidence/prediction intervals) into the price impact numbers.
Sensitivity of SOL performance to net ETP fund flows
Institutional configuration impact
In the past about 3.5 years, ETP capital flows have had varying degrees of impact on the price trend of SOL.Much of the price movement can be explained by factors outside the scope of this analysis.
However,We believe Solana will likely remain retail-dominated, thanks to its role as the go-to meme coin launch platform and its strong cultural cachet within the industry.
Institutional allocators may have a greater influence on price movements in the future.
in conclusion
The US SEC’s approval of the Solana ETF will be another milestone for the industry, but it may not promote its development in the short term.Historical experience shows that, like BTC and ETH, the approval of this ETF will be “priced in” in advance to a certain extent, and the risk of an initial correction is higher.
Over the long term, ETFs should be able to enhance and increase the attractiveness of the underlying securities to institutional investors by providing a low-cost, bankruptcy-free wrapper for the underlying securities.This would gradually increase institutional participation and may explain why SOL price action becomes more volatile over time, with the “multiplier” (beta coefficient) rising, enhancing price swings in both directions.