
Author: GMF Research
[Editor’s Note] Around 2000, the U.S. telecommunications infrastructure industry, represented by Lucent and Cisco, experienced a transition from high growth to collapse.In this report, we deeply review the collapse of the telecommunications industry in 2000, especially the collapse of Lucent, and compare the risk dimensions with today’s AI ecosystem.
We think,Compared with 2000, the current AI ecosystem has three major characteristics in common, and its vulnerabilities have initially emerged..However, supply chain finance is an amplifier rather than a trigger for the industry cycle, and the decline in capital expenditure demand is the fatal blow.In the short term, considering the relatively loose stance of the Federal Reserve and the current shortage of GPUs, market enthusiasm is expected to continue for some time.In the long term, the current most optimistic AI capital expenditure forecast means that AI must achieve the greatest success of mankind since the industrial revolution..
This article consists of six parts. The first part reviews the three causes of the telecom bubble in 2000; the second part briefly describes the three stages and market indicators after the bubble burst; the third part discusses Lucent’s supply chain financial collapse case in detail; the fourth part deconstructs the current circular financing ecology in the AI field and analyzes its three major similarities with 2000; the fifth part discusses four reasons for optimism; the sixth part concludes.
1. Causes of the telecommunications bubble in 2000
On March 10, 2000, the Nasdaq index climbed to 5048.6 points, accelerating its peak and skyrocketing by 40% in just one quarter. At that time, the market value of industry giant Cisco once exceeded US$500 billion, and the market value of Lucent once reached as high as US$240 billion.But then the prices of technology stocks peaked and plummeted. By March 2001, the Nasdaq fell by 60% in just one year. By the lowest point in 2002, the cumulative maximum decline reached 78%, and the telecommunications and Internet bubbles burst.Individual stocks were even more miserable. Cisco fell from a high of $80 per share in 2000 to about $15 at the end of 2001. Lucent fell from a peak of $65 in 1999 to less than $1 in 2002, a loss of more than 98%.The entire telecommunications equipment industry laid off more than 500,000 people from 2001 to 2003.
In hindsight, the bubble was the result of regulatory changes, technological progress, and loose monetary policy..
Figure 1: Nasdaq Index
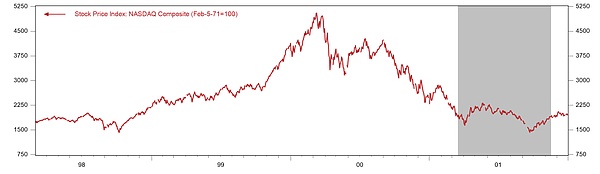
Data source: Haver, GMF Research
1) Regulation: The Telecommunications Act introduces excessive competition
The Telecommunications Act of 1996 was the most direct policy catalyst for the formation of the bubble..The core goal of the bill is to break the monopoly of the Regional Bell Companies (RBOCs) formed after the AT&T spin-off in local telephone services, and clearly declares that “any enterprise can enter any communications business, and any communications business can compete with any competitor in any market.”To achieve this goal, the bill requires that incumbent carriers (ILECs) must allow new entrants to interconnect at “any technically feasible access point,” resell services to competing local exchange carriers (CLECs) at wholesale prices, and provide “non-discriminatory unbundled access to network elements.”These provisions were intended to lower market entry barriers, but in practice they have reduced them to almost zero, and any company with capital believes that it can challenge traditional operators.
Within five years after the bill was passed, more than 300 CLECs emerged in the United States, vying for a piece of the local phone market..These new entrants have raised tens of billions of dollars from capital markets, promising to beat legacy carriers with new technologies and better services.However, the problem is that the market capacity is smaller than the new supply: US local phone service is a mature market with annual revenue of about 100 billion US dollars, with limited growth potential, but there are hundreds of players trying to carve up this pie.What’s more serious is that most CLECs lack real technical advantages or cost advantages, and their business models are based on regulatory arbitrage rather than value creation – by leasing the networks of incumbent operators at wholesale prices below retail prices, and then reselling them to end customers at a markup.This model is difficult to make a profit due to extremely fierce competition.By 2002, more than two-thirds of CLECs had filed for bankruptcy or were forced to withdraw from the market, and the industry’s cumulative losses exceeded $50 billion.
2) Investment: “It is never too much to lay more optical fibers.”
“Internet traffic doubles every 90 days” became the creed of the telecommunications industry at that time.From 1994 to 1996, US Internet traffic grew from 16.3 terabits per month to 1500 terabits (Odlyzko, 2002).This has led to unprecedented optimistic expectations for the market’s growth in bandwidth and optical fiber demand.“Internet traffic doubles every 90 days” became the most popular statement at the time.It first appeared in industry reports in the mid-1990s and subsequently spread virally through analyst reports and media reports.If this estimate is true, then demand is growing 16 times a year, and any current capacity will be exhausted within a few months, and no amount of fiber can be laid too much.WorldCom CEO Bernard Ebbers declared at an investor conference that “we are building not for today but for the needs of the next ten years.” Global Crossing’s prospectus promised that its fiber optic network would be fully saturated by 2005..
But many studies at the time pointed out that demand growth was not so crazy..Bell Labs researcher Andrew Odlyzko discovered by analyzing actual traffic data that although the explosive growth of “90-day doubling” did occur in a short period of time from 1995 to 1996, the real growth rate of US backbone network traffic after 1996 was only 100% per year.He further pointed out that the “90-day doubling” statement stems from a misreading of partial data and self-interested propaganda by industry participants.However, when his article was published, the bubble was close to its peak, and the fear of missing out (FOMO) was strong, so the article did not arouse widespread discussion.
What’s even more fatal is that technological progress has caused supply to expand far beyond demand..The maturity of dense wavelength division multiplexing (DWDM) technology allows a single optical fiber to transmit dozens or even hundreds of signals of different wavelengths simultaneously.According to the technological evolution from 1995 to 2000, the capacity of the DWDM system has surged from the initial 4-8 wavelengths to 128 wavelengths, which is equivalent to increasing the capacity of a single optical fiber by 16-32 times (conventional commercial systems), and advanced systems even reach 128-160 times.
The result is fiber deployment and waste on an astonishing scale.Between 1996 and 2001, the United States alone laid more than 80 million miles of optical fiber—enough to circle the Earth 3,200 times or to the moon and back 170 times.However, by 2002, industry analysis showed that only 5-10% of optical fibers were “lit” and put into use.More than 90% become “dark fiber” and are permanently buried underground or under the sea.“Wired” magazine sharply pointed out in a report in 2001: “The silicon economy obeys the law that supply creates demand. Too bad it’s not true for fiber.”
In hindsight, technological progress did occur, but the market’s misjudgment of progress and commercialization time turned the revolution into a financial disaster..The number of Internet users increased from 16 million in 1995 to 360 million in 2000, an average annual growth rate of 70%.However, the growth of users does not mean the simultaneous growth of bandwidth demand: early applications were mainly text and pictures; high-bandwidth applications such as streaming video did not become popular until the mid-to-late 2000s.Demand forecasts from the late 1990s had two key errors: users would grow indefinitely, and per-user bandwidth requirements were growing rapidly.The reality is that user growth slowed down after 2000, and the popularity of high-bandwidth applications was 5-7 years later than expected.
3) Currency: Greenspan failed to curb “irrational exuberance” in time
In the mid-to-late 1990s, loose monetary conditions fueled the telecommunications bubble.Since taking office as Chairman of the Federal Reserve in 1987, Greenspan’s so-called “Greenspan Put” has gradually been recognized by the market.What it means is that when financial markets encounter a crisisrate cut quicklyto support the economy and stock markets while remaining on the sidelines as asset bubbles inflate.This policy asymmetry leads investors to believe that downside risks will be borne by the Fed, thus tending to adopt more risky investment strategies.At the same time, the U.S. economy experienced its longest post-war expansion cycle from 1991 to 2000, with the unemployment rate falling below 4% and the inflation rate remaining moderate.In the context of this “Goldilocks economy”, Greenspan kept the federal funds rate relatively low: after a brief increase in interest rates from 1993 to 1994, the policy rate was stable in the range of 4.75% to 6% from 1995 to 1999, and the real interest rate (net of inflation) was at a historically low level of 2% to 3%.
In particular, Greenspan’s attitude toward bubbles was vacillating, and his warnings failed to translate into substantive policies..On December 5, 1996, he delivered his famous “irrational exuberance” speech in Washington, questioning whether stock market valuations had deviated from fundamentals: “How do we judge that irrational exuberance has excessively pushed up asset prices?” This statement immediately triggered turmoil in global stock markets.However, it did not change the relatively loose policy tone. After the Long-Term Capital Management (LTCM) crisis in 1998, Greenspan cut interest rates by 75 basis points, but the market randomly pointed out that this was unnecessary, and long-term U.S. bond interest rates rose sharply.These intervention measures have repeatedly sent a signal to the market that the Fed will provide support, further strengthening investors’ risk-taking tendencies.It was not until early 2000 when the bubble inflated to its limit that Greenspan initiated an interest rate hike cycle, which instead became the trigger to burst the bubble.
2. Three stages of bubble bursting and corresponding indications
The bubble burst around 2000 was roughly divided into three stages, with different signals and symptoms at each stage.
1) Macro: Monetary tightening and initial deterioration of aggregate demand
Monetary policy shift constitutes macro trigger for bubble bursting.On January 14, 2000, Federal Reserve Chairman Greenspan gave a speech warning of asset bubbles and inflation risks caused by the “wealth effect.” The Dow Jones Industrial Index peaked that day. The Federal Reserve subsequently raised the policy interest rate from 4.75% to 6.5% in the first half of 2000, a range of 175 basis points.In March 2000, the Nasdaq index reversed rapidly. Between March and April, Internet star Yahoo fell by 30%, eBay and Amazon fell by 40-50%, and Akamai and Commerce One plummeted by more than 70% in a single month.This round of stock market crash not only impacted investor sentiment, but more importantly “destroyed” the equity financing channels of telecom operators, making it difficult to continue to support network construction investment, resulting in the forced reduction of capital expenditure plans..Bond financing costs are also increasing rapidly, telecom operators’ credit spreads are widening, high-yield bond issuance is difficult, and business models that rely on debt expansion are unsustainable.
From the perspective of aggregate economic data, the significant decline in the manufacturing PMI in August 2000 provided clear evidence of macroeconomic slowdown..Since the end of 1999,ISM PMI officially peaked and fell.However, this was regarded by the industry as a cyclical fluctuation rather than a structural turning point at the time. The market’s profit expectations for equipment manufacturers had not yet been adjusted, and the S&P 500 was even close to reaching a new high in September 2000.But then the PMI accelerated its decline in the second half of 2000, and fell to the “deep manufacturing recession” range of around 42 in early 2001. Only then did the market realize that the downturn in the telecommunications industry was actually a structural deterioration.
Figure 2: Fed Policy Rate and PMI
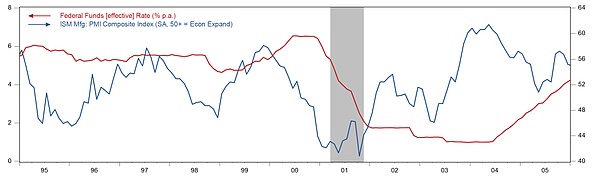
Data source: Haver, GMF Research
2) Performance warning: capital expenditure plan downward revision and corporate revenue warning
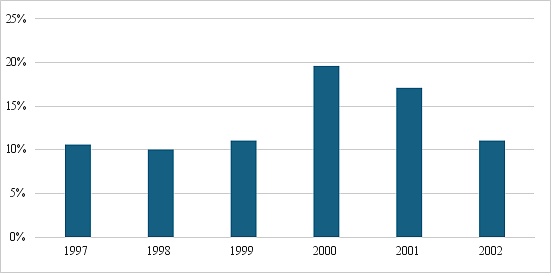
Communications equipment companies experienced sharp declines during the New Economy Collapse in 2001 and 2002, largely due to a sharp decline in capital equipment expenditures (CAPEX) in the U.S. telecommunications industry.From 1995 to 2000, the compound annual growth rate of capital expenditure in the communications field reached 23%, while from 2000 to 2003, it fell by 28%.Over-investment in the early stage caused the overall communication equipment investment of American companies to experience a long downturn, and it was not until 2015, 15 years later, that it exceeded the level of 2000.
Figure 3: U.S. corporate telecommunications equipment investment (Bil USD)
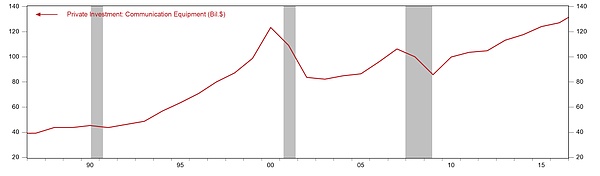
Data source: Haver, GMF Research
The performance warning issued by Lucent on January 6, 2000 was the earliest micro-alert in the telecommunications equipment industry chain..The company announced that Q1 earnings per share for fiscal year 2000 were about 30% lower than expected.Its stock price plummeted 28% that day from US$72.38 to US$52, and its market value evaporated by more than US$20 billion in a single day.CEO Richard McGinn admitted that “We are clearly disappointed with this quarter’s results,” but a company spokesperson insisted that “This is not an issue of demand…This is a bump in the road.”In fact,It was not until the second warning on July 20, 2000, that Lucent management confirmed that the decline in demand was a structural trend.It has fallen by more than 50% from the peak at the beginning of the year.In hindsight, the early warning in January was the earliest “canary in the coal mine” in the entire industry chain..
Cisco’s failure to meet performance expectations for the first time in February 2001 marked the fall of the leading equipment manufacturer.The company announced fiscal 2001 Q2 earnings per share that were only 1 cent less than expected, and revenue of $6.75 billion was lower than the expected $7.0-7.2 billion.CEO John Chambers warned that “business in January was more challenging than we anticipated.”However, just two months ago, on December 4, Chambers said, “I have never been more optimistic about our industry or the future of Cisco.”Chief Strategy Officer Mike Volpi still insisted in November 2000, “We haven’t seen any sign of a slowdown.”
At this stage, enterprise IT expenditures and telecom operator capital expenditures fell off a cliff in 2001..Telecommunications operators have cut their capital expenditures sharply. The investment spree in 1999-2000, when per capita investment in fiber optics exceeded US$500 and the cumulative per capita investment amounted to several thousand US dollars, came to an abrupt end.Operators such as WorldCom had a large amount of debt in the early stage, and debt pressure and financing difficulties forced them to cut capital expenditures by more than 50%.Cisco’s order backlog reached a record high in early 2001, but by March it had turned into excess inventory. Lucent’s new orders fell by more than 40% in fiscal year 2001.
3) Crash: Inventory write-downs, soaring credit bad debts, and exposure of accounting fraud
Cisco announces $2.25 billion inventory write-offs in March 2001 marks disaster official.Cisco is known as having the most advanced virtual supply chain and real-time IT systems.However, this system is based on a fatal assumption: demand will continue indefinitely with an annual growth rate of 30-50%.A postmortem revealed that Cisco “never built a model to predict an event of this magnitude” and that no downside scenarios were included in the forecasting system.Selby Wellman, a retired executive, recalled the summer of 2000: “Our forecasts were still incredibly high. We wanted to make sure growth was strong, so we ordered a lot.”The “bullwhip effect” of the supply chain amplifies inventory disasters.Ajay Shah, CEO of Cisco’s manufacturing partner Solectron, explained the mechanics of order double counting: “People see shortages and intuitively predict higher. The purchase requires 100 parts, but they know that if they ask for 100 they will only get 80, so they ask for 120 to get 100.”Internal case studies show that when a product team actually needed 10,000 units, three independent suppliers each produced 10,000 units, resulting in triple inventory accumulation.What’s more serious is that a large number of products are customized for customers and cannot be resold, and technological iterations rapidly depreciate obsolete inventory. As a result, huge inventories suffer write-downs.
Large-scale bad debts in supplier financing have eroded all the profits accumulated over the years due to customer defaults..Lucent, Nortel, and Cisco have collectively committed more than $13 billion in credit to downstream companies.The logic of this kind of supplier financing is to lend money to operators with tight cash flow to purchase their own equipment during the capital market frenzy, so as to stimulate revenue growth in the short term, and it is treated as accounts receivable rather than loans in accounting, concealing its credit risk nature.When large customers such as WorldCom and Global Crossing fell into financial difficulties and eventually went bankrupt in 2001, equipment manufacturers’ accounts receivable turned into bad debts on a large scale.In the next section, we describe the Lucent case in detail.
Massive exposure of accounting fraud puts final nail in bubble’s coffin.WorldCom began to include capital expenditures in expense items at the end of 2000 to inflate profits. Internal audits discovered anomalies in May 2002 and reported them to the board of directors. In June, the SEC launched an investigation. On July 21, WorldCom filed for bankruptcy, becoming the largest bankruptcy case in U.S. history at the time, involving US$107 billion in assets and US$41 billion in liabilities.Enron hid debt and fabricated profits through hundreds of related-party special purpose entities (SPEs), using mark-to-market accounting to immediately recognize estimated profits from contracts over the next 20 years as current revenue.In July 2001, Enron’s revenue doubled compared with the same period last year while the industry generally contracted. In August, CEO Jeffrey Skilling suddenly resigned and sold US$35 million in shares. In October, it announced a restatement of its financial report and reduced its 1997-2000 profits by US$586 million by about 23%. It filed for bankruptcy on December 2.SEC investigations during the same period showed that Lucent improperly recognized $679 million in revenue in fiscal year 2000, Nortel inflated revenue by more than $3 billion from 2000 to 2001, and Qwest Communications inflated revenue by more than $3 billion.Statistics show that between 2000 and 2002, more than 30 major telecommunications and network equipment companies were forced to restate their financial reports, with cumulative profit reductions exceeding US$100 billion.
3. Review of Vendor Financing—taking Lucent as an example
First of all, it needs to be emphasized that supplier credit is not a “scourge”, nor is it always synonymous with bubbles. It is widely used in capital-intensive industries..For example, in the equipment rental industry, such as heavy machinery, suppliers such as Caterpillar support customer purchases through credit; in the agricultural equipment industry, companies such as John Deere use this model to help farmers purchase agricultural machinery.DataIntelo estimates that the global supplier financing market will be approximately US$220 billion in 2024, with a compound growth rate of 8.2% expected over the next 10 years.That said, the Lucent case is worth revisiting because it highlights the amplifying effect of supplier credit both up and down the cycle.
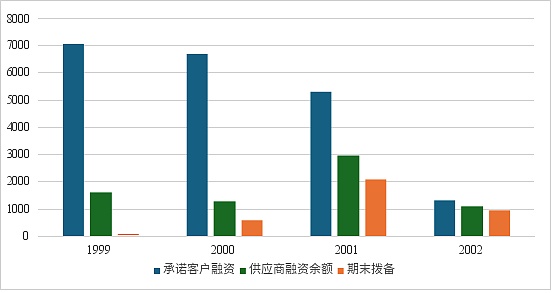
Lucent’s supplier credit once accounted for more than 10% of revenue.In 1999, Lucent was the world’s largest telecommunications equipment company, with revenues of $38.3 billion and 153,000 employees.In order to seize orders for CLECs from competitors, Lucent adopted a highly aggressive “vendor financing” strategy – the company not only sold equipment, but also provided loan financing to customers.thisThere are two benefits.First, it has locked in the needs of downstream customers for a long time and its orders are guaranteed.The second is to solve the problem of lack of money and difficulty in financing for downstream start-up customers.By the end of fiscal 1999, Lucent had committed up to $7.1 billion in supplier financing to customers, of which $1.6 billion had been withdrawn to purchase Lucent equipment, accounting for 4.2% of its revenue for the year.By 2001, the total amount of customer credit drawn had risen to 2.96 billion, accounting for 13.9% of revenue.In other words, for every 100 US dollars of goods sold by Lucent, about 14 yuan comes from its own “advance capital.”
Figure 4: Lucent customer credit balance (Mil USD) and drawn amount as a proportion of revenue
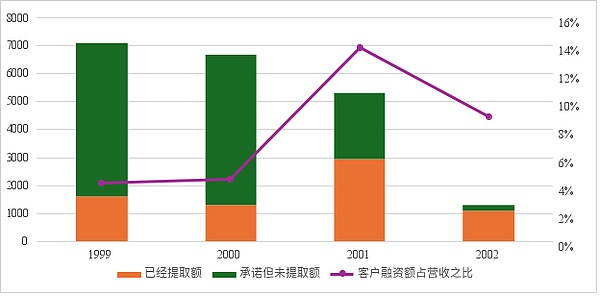
Data source: Lucent 10-K, GMF Research
From a risk perspective, supplier finance means that upstream equipment manufacturers use their own money to complete their own KPIs. In fact, they transfer the downstream revenue risks to themselves..Between 2000 and 2003, at least 47 CLECs filed for bankruptcy, including well-known companies such as Covad, Northpoint and Winstar.After the bubble burst, equipment manufacturers represented by Lucent suffered huge losses.Specifically, Lucent suffered a disastrous “triple writedown”.
The first “write-down” is that of supplier financing bad debts.In 1999, Lucent’s supplier loan provisions were very small, only $34 million, accounting for less than 0.1% of total revenue.But starting in 2000, with the bankruptcy of star customers WinStar and NorthPoint, Lucent’s supplier loan provisions increased rapidly, soaring to 604 million in 2000, equivalent to 2.1% of its revenue that year.By 2001, it surged 250% to an astonishing 2.12 billion, equivalent to 9.9% of Lucent’s total revenue that year.Lucent suffered a net loss of US$16.6 billion in fiscal year 2001.Looking at the proportion of provisions to existing loans, during 2000-2002, 46.5%, 71.3% and 86.7% of the loans issued by Lucent were included in provisions.In other words, by 2002, 87 yuan of the 100 yuan loan issued by Lucent had become bad debts.In particular, when a customer goes bankrupt, due to the industry downturn and excessive initial investment, the network equipment used as collateral is almost “worthless” and the loan recovery rate is extremely low.
Figure 5: Lucent customer credit bad debt provision balance (Mil USD)
Data source: Lucent 10-K, GMF Research
Figure 6: Lucent’s supplier loan provision balance as a percentage of revenue
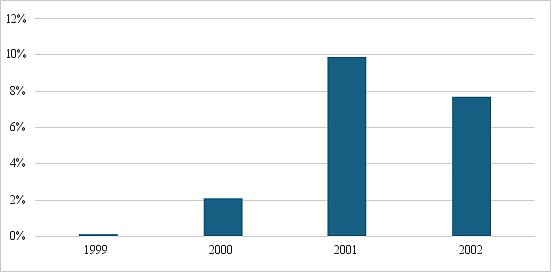
Data source: Lucent 10-K, GMF Research
The second “write-down” is the inventory write-down.The illusory order picture brought about by supplier financing caused Lucent management to seriously overestimate the true demand of downstream CLEC.Lucent management hinted to the market and investors at the end of 1999 that approximately $540 million in undrawn financing commitments were expected to be activated and used to purchase its products within the next 12-18 months.Its profits in the first quarter of fiscal year 1999 exceeded expectations, and profits in the second quarter doubled. Overall revenue increased by 27% to US$38.3 billion, and net income was US$4.8 billion, exceeding market expectations.Amid this optimism, Lucent has also amassed a large inventory of customized optical and wireless equipment for future sales.By the end of fiscal year 1999, Lucent’s total inventory reached $4.24 billion.But these inventories are often highly specific and cannot be easily resold to other buyers.Since 2000, Lucent’s inventory provisions have risen rapidly.In 1999, its inventory provision balance was only US$709 million, accounting for approximately 1.9% of total revenue.But it rose to US$892 million in 2000, equivalent to 3.1% of its revenue that year, and surged 103% to US$1.814 billion in 2001, equivalent to 8.5% of Lucent’s total revenue that year.Judging from the proportion of reserves to existing inventory, during 2000-2002, 15.7%, 49.8% and 109.3% of Lucent’s inventories were included in reserves.Among them, in 2001,Lucent accrued an additional $2.4 billion in inventory impairment reserves in a single fiscal year, equivalent to 42.4% of the previous year’s inventory balance.
Figure 7: Lucent inventory to revenue ratio
Data source: Lucent 10-K, GMF Research
Figure 8: Lucent inventory provisions (Mil USD) and ratio to revenue
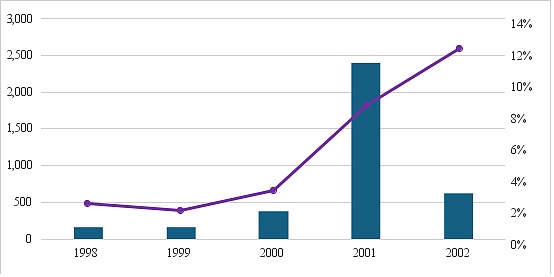
Data source: Lucent 10-K, GMF Research
The third “write-down” is bad debts on accounts receivable.Lucent stimulated revenue growth through credit sales of equipment and services in fiscal year 1999-2000. By the end of fiscal year 1999, its net accounts receivable reached US$8.8 billion, which further increased to US$9.56 billion during 2000. Accounts receivable accounted for 23% and 33% of total revenue respectively..However, as the finances of major customers such as Global Crossing and WinStar deteriorated and downstream customer bankruptcies emerged, Lucent’s accounts receivable provisions increased sharply. In 1999, they were only US$320 million, accounting for approximately 0.8% of total revenue, but rose to US$500 million in 2000, equivalent to 1.5% of its revenue that year.By 2001, it surged 26% to US$630 million, equivalent to 3.0% of Lucent’s total revenue that year.During 2000-2002, 5.2%, 13.8% and 19.7% of Lucent’s accounts receivable were provided for.In particular, these figures underestimate the true losses,Because some receivables are sold by Lucent to third-party financial institutions to beautify financial reports, and when customers default, Lucent also needs to bear repurchase obligations or guarantee liabilities.
Figure 9: Lucent’s accounts receivable balance as a percentage of revenue
Data source: Lucent 10-K, GMF Research
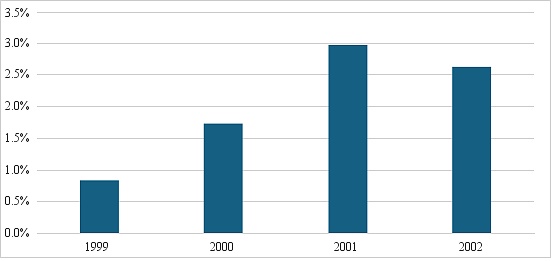
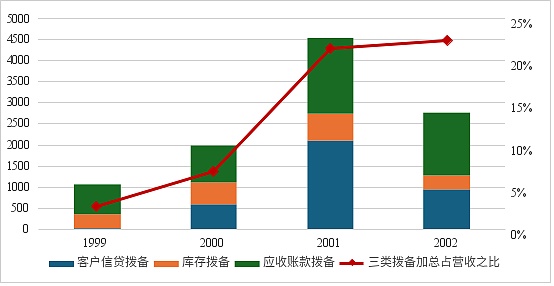
Combining the above three types of write-downs,The total of Lucent’s three types of provisions surged from US$1.06 billion at the end of 1999 to US$4.56 billion in 2001, an increase of 330% in just two years, and the proportion of Lucent’s revenue soared from 2.8% to 21.4%.This roughly means,For every US$1 of revenue Lucent received in 2001, an average of approximately 20 cents was needed to cover impairment of various assets.
Figure 10: The total amount of Lucent’s three types of provisions and their ratio to revenue
Data source: Lucent 10-K, GMF Research
4. Three major similarities between the current revolving credit in the AI field and that in 2000
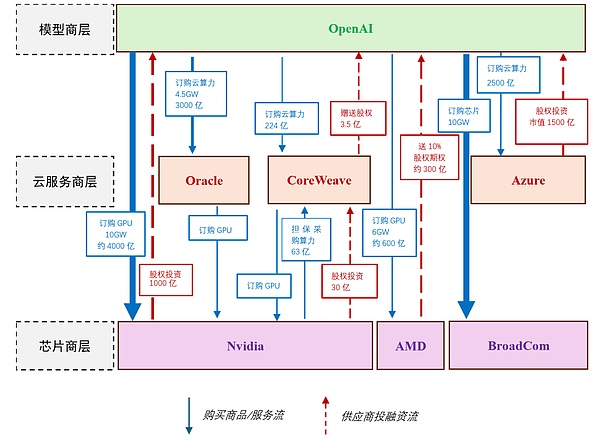
In order to facilitate comparison with before and after 2000,This article divides the current enterprises in the AI field into three levels.
The first layer is the model provider layer (AI Model Providers), which mainly involves the development, training and deployment of AI models..Representative companies at this level include OpenAI, Anthropic, xAI, Mistral AI, etc.These companies focus on creating large language models (LLM) and generative AI systems, and their main expenditures focus on the procurement of computing resources, including leasing data center capacity from cloud service providers and ordering GPUs from chip manufacturers. These expenditures often account for more than 70% of total expenditures.The main revenue comes from API service subscriptions, enterprise-level solutions and licensing agreements.
The second layer is the Cloud Infrastructure Providers layer, which provides computing infrastructure and services to model providers..Representative companies include Oracle, CoreWeave, Microsoft Azure and Amazon Web Services (AWS).These companies build and manage data centers, and their main expenses are hardware procurement, energy consumption and maintenance (data center electricity costs can account for 40-50% of total expenses).The main revenue comes from cloud computing rental and hosting services.
The third level is Semiconductor Manufacturers, which focuses on the core manufacturing of AI hardware and provides underlying support for computing power..Representative companies include NVIDIA, AMD, Broadcom and Intel.These companies design and produce GPUs, accelerators and processors, and their main expenses are investment in R&D innovation and manufacturing facilities.The main revenue comes from chip sales and related ecological services.
Figure 11 summarizes the product service ordering status and committed investment among the three levels of AI companies.Among them, the blue solid line is the arrow for the provision of goods (mainly chips) and services (cloud computing services), and the red dotted line is the investment and financing arrow.Based on this arrangement,We think,From a risk perspective, there are at least three important similarities between the current NVIDIA-OpenAI AI ecosystem and the Lucent-CLECs telecommunications equipment ecosystem in 2000.
Figure 11: Current circulating financing for suppliers in the AI field
Data source: Internet, GMF Research
1) Expectations: All are based on highly optimistic expectations for the capital expenditure and revenue capabilities of downstream companies.
In the late 1990s, the narrative of “Internet usage doubling in 90 days” convinced investors that there was no “over-investment” in the fiber optic field.As a result, CLECs are overbuilt$60 billionfiber capacity, while installed fiber was underutilized when the bubble burst5%.Today, we also hear many optimistic statements in the market, such as “AI is the new electric energy and will reshape all industries” and “the global AI market will reach the trillion-dollar level in the next few years.”Jensen Huang’s expectations on Nvidia’s 2025 Q2 earnings call“Over the next five years, we plan to effectively scale into a $3 to $4 trillion AI infrastructure opportunity through Blackwell, Rubin and subsequent developments. We are only in the early stages of this expansion.”
Driven by this optimism,At present, the capital expenditures of leading AI companies are expected to be in units of “hundreds of billions” or even “trillions”, which has already far exceeded the conventional magnitude of expenditures by a single enterprise.For example, the $300 billion cloud computing agreement signed between OpenAI and Oracle involves the purchase of 4.5GW of computing power. It is one of the largest single cloud service contracts in the history of technology, exceeding the annual capital expenditure of the global semiconductor industry in 2024.OpenAI purchased a 10GW GPU system from Nvidia to build its own data center. Based on an estimated chip cost of US$40 billion/GW, the total expenditure may exceed US$400 billion.In addition, OpenAI also purchased 6GW and 10GW of chips from AMD and Broadcom respectively, with a total investment of hundreds of billions.Added together, the total value of these agreements exceeds $1 trillion.For comparison, the total investment in information processing equipment in the U.S. GDP in 2024 is only US$500 billion, and the total investment (equipment + factory buildings) of all enterprises is only about US$4 trillion.It is of course possible that these optimistic expectations will eventually come true;But the lesson of history is that the risk often lies not in the ultimate feasibility of the technology, but in the stability of the financial system that supports the technology ecosystem and the vulnerability of downstream customers who lack a profit base once phased headwinds arrive.
2) Financing: Downstream companies are burning a lot of money and are highly dependent on supply chain financing.
Back then, downstream enterprise CLECs generally relied on supply chain financing and other financing methods.In 1999, CLECs’ capital expenditures reached $15.1 billion, while revenue for the same period was only $6.3 billion.This means that for every dollar they earn, they spend 2. on construction, and more than 60% of construction funds must be financed through external financing or debt.Today, astronomical capital expenditures far exceed the revenue capabilities of large model companies.Taking OpenAI as an example, its expected revenue in 2025 is about 13 billion, and its expected capital expenditure in the next 10 years is as high as 1 trillion US dollars.This forces it to rely on “supply chain financing” provided by upstream companies, thus forming a circular financing ecosystem.Judging from the current circular financing ecology in the AI field, it can be roughly divided into two types:.
One is the direct capital injection type.As the player with the most abundant cash flow in the AI field, Nvidia has adopted a strategy of direct equity investment in customers.Its (committed) investments in OpenAI and CoreWeave are as high as US$100 billion and US$3 billion respectively to ensure priority for hardware orders and provide customers with part of the required funds.At the same time, it also provides CoreWeave with an additional 6.3 billion guaranteed purchasing computing power, which is equivalent to the computing power corresponding to purchasing its own chips.
The other is the gift stock type.Players such as AMD and CoreWeave, which have relatively scarce funds and relatively weak market positions, adopt a “give away shares in exchange for orders” strategy.In order to seize market share from Nvidia, AMD issued 160 million low-price warrants to OpenAI, which allows OpenAI to obtain approximately 10% of AMD’s equity.In essence, AMD is exchanging future equity dilution for current orders and market position.These shares are vested in batches and are linked to the deployment progress of 6GW GPUs. The last batch can only be fully released when AMD’s stock price reaches $600.Based on the current market value of AMD, this batch of equity is worth approximately 30-40 billion.Similarly, CoreWeave also provided US$350 million in equity in the agreement as an incentive for OpenAI, a major customer.
3) Concentration: The concentration of upstream companies in a single industry is very high
For the telecommunications industry back then, although downstream CLECs customers were relatively dispersed, they were actually highly homogeneous.Judging from the 1999 financial report, Lucent’s top three customers (including AT&T, Verizon and Sprint) contributed a total of 37% of revenue. The remainder mainly relied on CLECs such as WinStar, NorthPoint and Covad. Although these customers are large in number, their financial models and industry risk exposures are highly similar. Once they go bankrupt, there will be a wave of bankruptcy.By 2002, 23 telecommunications companies were bankrupt, with total assets exceeding $100 billion.
The current AI field is more like an “oligopoly competition” pattern, and the demand for computing power is rapidly concentrating on OpenAI.Taking NVIDIA as an example, the top two customers accounted for 39% of the revenue, and the top four customers accounted for 46%. The concentration was significantly higher than that of Lucent back then.In particular, recent reports show that OpenAI’s share of total computing power demand is rapidly increasing.At present, the total amount of computing power OpenAI has “committed” to purchase from upstream manufacturers has exceeded 50GW, including a 10GW GPU deployment agreement with NVIDIA, a 6GW GPU supply agreement with AMD, a 10GW custom accelerator order with Broadcom, 4.5GW cloud computing services with Oracle, and more than 20GW computing power procurement with CoreWeave.Sam Altman once said in an interview that he hopes to obtain more than 250 gigawatts of computing power in 2033, which is equivalent to 1/3 of the electricity consumption in the United States.For comparison, the power demand for U.S. data centers (including artificial intelligence) in 2024 will be approximately 30-50 GW.In other words, OpenAI’s promised computing power demand will double the computing power of U.S. data centers.It can be seen thatWhether it is CLECs that were perfectly competitive but highly homogeneous back then, or today’s oligarchic customers that provide huge orders, once they face an industry downturn, failed technology iterations, or a lack of funding, the impact on upstream suppliers will be single-point and fatal.
5. Four reasons for optimism
Despite the similarities to 2000, there are reasons to be more optimistic about AI today.
First, the financial status of the model giants in today’s AI industry is better than that of CLECs in 2000..The services provided by CLECs are standardized fiber optic connections and voice/data transmission, lacking a moat. The only factors for competition are network scale and price, which leads to price wars and collapse of profit margins. The result is that the financial health of CLECs is generally poor, with an average debt-to-equity ratio of more than 5:1, and most of them are in negative cash flow and losses, and are highly dependent on external funds to maintain operations.Compared with CLECs, although OpenAI is also in a loss-making state, it has a deeper moat, stronger monopoly power and better revenue.Other model giants generally have “funder fathers”. For example, Anthropic is backed by Amazon and Google, and xAI is backed by Elon Musk, and its financial pressure is relatively optimistic.special,Although AI downstream companies rely on upstream supply chain financing, they mainly rely on equity rather than loans like in 2000 (AMD issued warrants to OpenAI, and NVIDIA made equity investment in OpenAI). Therefore, it is not easy to have large one-time credit provisions like Lucent and Cisco.
Second, we have not yet seen “predatory loans” like those in 2000..Back then, competition was not only fierce among CLECs;Upstream manufacturers such as Cisco and Lucent are also highly competitive, making their loan policies particularly aggressive and risky.Take Harvard Network, a Boston-based provider of high-speed Internet connections and fiber optic data transmission services.Harvard Networks began offering digital subscriber line services to corporate customers in 1996.Two years later, it had annual sales of less than $5 million, annual losses of more than $1 million, and a negative net worth.To survive and expand, the young company needed new equipment.It originally ordered equipment from Paradyne Networks, but eventually switched to Cisco because Cisco provided a credit of up to $120 million and even allowed it to use 25% of the loan to order non-Cisco products.By the end of 2000, HarvardNet finally went bankrupt.In contrast, although the current supply chain financing in the AI field is large, the competition is not extreme and it is not as predatory as it was at that time.
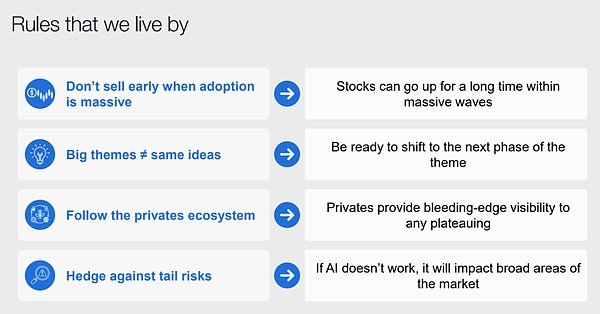
Third, from a macro liquidity perspective, the Federal Reserve will maintain a loose monetary policy in the next 12 months and will not choose to “actively burst bubbles.”.There are clear signs of a slowdown in the U.S. job market, with the average number of new jobs per month falling sharply from around 200,000 in 2024 to around 30,000 currently. Behind this are not only the “reduced labor supply” caused by the immigration deportation policy, but also the replacement effect of the AI revolution on junior employees, and the “lazy man” effect caused by extremely loose fiscal policies.But on the other hand, AI investment and wealth effects have made overall consumption and investment not weak, but GDP has increased rapidly. The U.S. economy has shown a significant two-speed economy of “low employment and strong growth”.Since the Fed’s twin goals are price stability and full employment, even if economic growth is strong, as long as employment is soft, the Fed is more likely to maintain an accommodative stance.In such an environment, even if investors know that a bubble exists, they may continue to hold risky assets out of fear of leaving the market too early and missing out on losses.In fact,The author observed a very interesting signal that in a report released in October, the well-known technology investment fund Coatue (one of the Tiger Club) listed “don’t sell too early” as an important reason to continue to be bullish on technology stocks. In previous years, their bullish logic was still “AI will change everything.”
Figure 12: Coatue’s latest report in October 2025
Data source: Coatue, GMF Research
Last but not least, the usage rate of GPUs and other computing chips today is much higher than that of optical cables at that time, and there is no so-called “dark GPU” for the time being.One of the core contradictions of the 2000 bubble wasOptical cable investment “supply exceeds demand”, afterwards the industry discoveredMore than 90% of deployed fiber optic cables are fromWhen not in active use, it is called “dark fiber”.In comparison, data center GPU utilization is much healthier today.Since the training and inference requirements of AI models are still atexplosive growth stage, on the marketGPUs are still in short supply, even if it is deployed computing power, itsUtilization also remains relatively high(Especially at the cloud service provider level), the market estimates that the overall GPU load rate in the data center is approximately between 50-70%.
To sum up, in the short to medium term, the AI cycle may continue to rise, and the “lice under the blanket” may not be revealed for the time being.
6. Summary: The future of AI
There is only one most important question that determines whether today’s AI craze is a bubble:Can Tianliang AI’s current capital expenditures obtain the return on investment it deserves?.Here, we provide a simple estimate.
If calculated according to Huang Renxun’s most optimistic total capital expenditure of 3 trillion in the AI field, assuming that GPU depreciation is 30% per year (the author does not believe that depreciation of 5 years or longer is reasonable), and assuming that the ROE required for AI investment is 30% (this value is slightly lower than the ROE of the current technology giants), then under the background of 25% corporate income tax, the required annual EBITDA is about 2 trillion US dollars.If we further assume that the EBITDA profit margin of AI companies is 30% (equivalent to the level of cloud service providers) to 60% (equivalent to Nvidia level),The total annual revenue required by the AI industry is approximately US$3.3-6 trillion.
What is this concept?In 2024, the total revenue of the global automotive industry will be approximately US$4-5 trillion, the total revenue of the advertising industry will be approximately US$8,000-1 trillion, and the revenue of the mobile phone industry will be approximately US$500 billion.This means that the future revenue scale of the AI industry needs to equal the automotive industry, reaching 5 times that of the advertising industry, or 10 times that of the mobile phone industry.In other words, AI must become mankind’s greatest success since the Industrial Revolution to be worthy of the most optimistic expectations.
Looking at it from another angle,Assuming that there are 1 billion active AI users in the world in the future, each user’s annual revenue contribution needs to reach US$3,300-6,000; if the number of active users rises to 3 billion, the average annual revenue contribution of each user needs to be US$1,000-2,000.Such a huge per capita revenue contribution and global usage base will mean that AI in the future may have to penetrate into all aspects of residents’ daily necessities, and achieve greater success than the Internet.
This is not impossible.But if the bursting of the telecom bubble in 2000 taught us the most important lesson, it is that bubbles and crashes always go hand in hand with technological progress.As an investor, the most important thing is to be prepared for danger in times of crisis and survive until the next cycle.