NFT trading activity showed signs of recovery in the third quarter of 2025, breaking a long-term downward trend in the post-hype period.
After two years of market contraction and narrative shifts, the on-chain market has found a new footing, with its growth driven no longer by blue-chip collectibles or speculative art, but byfrom lower-cost infrastructure, loyalty programs and sports-related assets.
These assets are traded for utility, not status symbolism.
NFT transaction volume rebounds, sales hit record high
As the expansion and upgrade of Ethereum promotes the migration of transaction activities to L2, Solana has gained a foothold with its high throughput and compression technology, and Bitcoin Inscription has developed into a collection culture that is linked to the handling fee market and alternates between rise and fall. The focus of the NFT market has shifted to low-cost infrastructure and practical application scenarios.
Today, the key to driving market growth is fee levels and distribution channels, not avatar NFTs.
Economic landscape reshaped after Dencun upgrade,Ethereum’s EIP-4844 proposal reduces the data cost of rollups, bringing L2 layer transaction fees down to a few cents, and supports gas-free minting or sponsored minting processes for mainstream users.
After the upgrade, L2 layer handling fees dropped by more than 90%. This change has been reflected in the minting behavior and has also promoted Base to become a core distribution channel.
In the Solana ecosystem, compression technology makes it possible to issue large-scale NFTs for loyalty programs and permissioned access applications.
The deployment cost of 10 million compressed NFTs is approximately 7.7 SOL,Even under high load, the median transaction fee is still close to $0.003.
Bitcoin Inscription has opened up an independent track, and its development is closely related to the memory pool cycle and miner income.As of February 2025, the number of inscriptions has exceeded 80 million, ranking among the top three in terms of historical NFT sales.
Demand side rebounds but there are concerns
DappRadar data shows,In the third quarter of 2025, NFT transaction volume nearly doubled from the previous quarter, reaching 1.58 billion U.S. dollars, and sales reached 18.1 million, setting a record high in the number of quarterly transactions..
Sports NFTs performed particularly well, with transaction volume soaring 337% month-on-month to $71.1 million.The cyclical practical value, rights and interests and loyalty benefits of this type of assets decouple their consumption behavior from the reserve price.
The market first rebounded quickly in the summer and then cooled down: according to CryptoSlam statistics, sales in July 2025 reached US$574 million (the second highest of the year). In September, affected by the fall in risk appetite in the overall encryption market, sales fell by about 25% month-on-month.
This trend confirms that the market has entered a new stage of “lowering average selling prices” and also shows that even if the number of unique users and practical application categories remain stable, the total NFT transaction volume will still change with the overall fluctuations of the crypto market.
The key role of distribution channels has become increasingly prominent.Wallets with built-in key functions and sponsorship fee mechanisms eliminate the friction costs that hindered user entry in previous cycles..
Coinbase Smart Wallet provides key login and gas fee sponsorship services in supported applications; Phantom announced that it had 15 million monthly active users in January 2025. This user base provides traffic support for mobile and social minting channels.
In a blockchain network where culture and social traffic empower each other, this distribution and reach capability is crucial, and Base is a typical case.
This year, with low-cost minting, Zora’s batch minting cadence, and distribution channels associated with Farcaster,Base’s NFT trading volume has surpassed Solana in some indicators.
This trend means that when creators choose a distribution platform, they have begun to model distribution data and then reversely match the fee plan.
Royalties are no longer central to the revenue structure
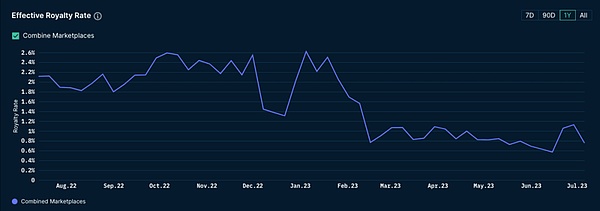
After the market peak in 2022, creators’ royalty income has fallen sharply as competition among trading platforms has led to royalties becoming optional in most markets.
According to Nansen data, royalty revenue hit a two-year low in 2023 and failed to recover to previous levels.
In contrast to this trend, trading platforms that support mandatory collection of royalties are gradually emerging.At the end of 2023, Magic Eden and Yuga Labs jointly launched the Ethereum trading platform to force creator royalties and open up a protected distribution channel for influential brands.
The current market has formed a dual-track pattern:In the open market, low commission ratios, primary market sales, intellectual property (IP) cooperation and retail linkage constitute the main source of profit for creators; while the closed ecosystem compulsorily collects royalties through contractual agreements and undertakes high-end NFT issuance.
In an area where incentive mechanisms dominate capital flows, the market share of trading platforms is still changing dynamically.
In the Solana ecosystem, Magic Eden and Tensor form a duopoly competition. The market shares of the two will fluctuate with reward plans and program design adjustments. Their respective market shares are usually between 40% and 60% in different periods.
This is not a structural change, but the result of the incentive cycle.,Market share charts may appear to be shifting, but eventually they revert to the mean.
The core takeaway for creators is to negotiate a distribution plan during the release planning stage, rather than defaulting to a single platform.
User flow reveals short-term development route
Sports, ticketing and loyalty programs can achieve scale because their benefits are cyclical and repetitive, and the core functions on the chain are embedded in existing ticketing and e-commerce processes.
DappRadar’s data for the third quarter of 2025 shows that the growth rate of sports NFT transaction volume has exceeded the overall market, and this does not include full season or league-level cooperation projects.
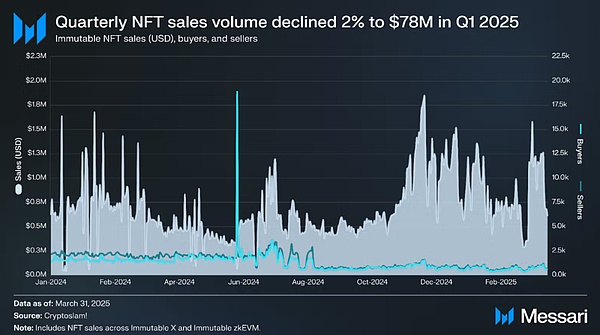
Growth in the gaming sector is more robust.According to Messari data, Immutable’s zkEVM architecture and real-time data show that transactions continue to grow. Its design of “ensuring security at the Ethereum level and optimizing user experience at the L2 level” is highly consistent with the demand for asset custody and continuous secondary transaction fees.
Intellectual property rights and licensing cooperation are another important bridge for NFTs to move from digital collections (JPEGs) to consumption channels.Pudgy Penguins has entered more than 3,000 Walmart stores, building a channel from NFT to physical retail and licensing revenue.
For creators, the cost and user experience of each blockchain are now clearly identifiable:
The Ethereum L1 layer still dominates the fields of traceability certification and high-value artworks. Gas fees on most platforms fluctuate greatly, and royalty collection is optional;
After the Dencun upgrade, the transaction fees of the Ethereum L2 layer (such as Base) have been reduced to a few cents, supporting sponsored or gas-free transactions, and the Base and Farcaster ecosystems provide social distribution channels;
Solana’s compression technology enables issuance costs of millions of NFTs to be controlled at the US dollar level,And relying on the mobile-first wallet ecosystem to achieve broad reach;
Bitcoin Inscription focuses on the field of scarce collectibles, and rising handling fees are its market characteristics rather than defects.
Evolution of macro-environmental pattern
The annual transaction volume of the NFT market in 2025 is expected to be in the range of US$5 billion to US$6.5 billion, and the average selling price in the first half of the year will remain at US$80 to US$100. This level forms the baseline for next year’s market scenario.
Taking CryptoSlam’s monthly sales as the core data, combined with DappRadar’s category split analysis:
bear market scenario: If the overall encryption market stagnates and the average selling price falls, the total NFT transaction volume may drop to 4 billion to 5 billion US dollars. Cost-sensitive application scenarios will be concentrated in Solana and Ethereum L2 layer. The Ethereum L1 layer art market remains stable, and the inscription market fluctuates with the Bitcoin handling fee cycle.
Baseline scenario: If embedded wallets and social coinage channels continue to expand, sports and live event projects scale up across seasons, and brands try to issue new products on mandatory royalty platforms, the total NFT transaction volume is expected to reach US$6 billion to US$9 billion.
bull market scenario: If mobile distribution achieves breakthrough growth (Base and key login popularize the minting process, Phantom monthly active users exceed 20 million, ticketing pilot projects become mainstream solutions, and game assets form sustainable transactions),Total NFT transaction volume could reach $10 billion to $14 billion.
In the above three scenarios, the market share of Ethereum L2 layer and Solana will dominate, Ethereum L1 layer focuses on niche areas, and Bitcoin Inscription will stabilize as a scarce collectible.
Six key variables determine the pace of growth
1. Wallet user experience and distribution capabilities: Core observation indicators include key adoption rate, sponsorship fee usage, and the number of monthly active users of Phantom and Coinbase smart wallets.
2. Coverage of mandatory royalty collection: Impact on high-end NFT issuance, including OpenSea’s policy shift, and the health of the trading platform that supports creators in the Ethereum ecosystem.
3. Scaling sports and ticketing cooperation: expanding from pilot projects to full-season cooperation, converting one-time transaction amounts into periodic revenue.
4. The issuance rhythm of Base and Zora: The sustainability of the social distribution channel can be judged through the monthly coinage, Base’s proportion in the total NFT transaction volume and the linkage effect of Farcaster Frames.
5. Adoption rate of Solana compression technology: By compressing the amount of NFT coins minted and the deployment cost per million assets, it can be judged whether loyalty programs and media applications have moved from pilot to normalization.
6. Bitcoin fee cycle: Its relationship with inscriptions and runes will change with the congestion level of the memory pool and continue to affect the pricing of collectibles.
But two risks always remain.Wash trading and spam can still skew GMV and sales, so looking at average sales and organic search filtered dashboards is a safer approach.
The incentive mechanism of the trading platform may cause the market share chart to show the illusion of “pattern change” (actually the impact of the airdrop cycle), especially in Solana’s duopoly structure.
Therefore, creators’ release planning should take this fluctuation into account from the beginning.
Another operational constraint is revenue design: in an open market where royalties are mostly optional terms, primary market sales, intellectual property licensing and retail cooperation bear more of the burden of revenue.
Closed platforms with mandatory royalties can only provide high-end distribution channels for a few brands, making it difficult for most creators to take advantage.
Industry transformation from “finality” to “migration”
The JPEG hype boom has ended, NFT infrastructure costs have been significantly reduced, application scenarios have shifted to the fields of ticketing, sports, games and intellectual property, and wallets and distribution systems have also begun to penetrate users’ existing scenarios.
Blue-chip NFT flagship project “Bored Ape Yacht Club” is still in a precarious position for investors who have invested six figures in purchasing AWS-hosted JPEGs.
An NFT of this series that was sold for over 74 ETH in 2021 is now worth only 9 ETH, a drop of 87% in three years.
The speculative boom in the NFT space may be over, but will this allow the underlying technology to gain acceptance in real-world practical scenarios?
The answer remains to be tested by time, but the current signs are promising, but this hope has nothing to do with those who are stuck at a high position.
In the third quarter of 2025, the NFT market ended with a transaction volume of US$1.58 billion and 18.1 million sales.The market structure has continued to evolve in the direction of practicality.