Author: On-Chain Mind, Compiled by: Shaw Bitcoin Vision
The Bitcoin market is coming alive.After months of consolidation and relative calm, markets are showing some subtle but clear signs that a long-awaited year-end bull run may finally be within reach.
Market volatility has increased, short-term holders are stepping up to defend their positions, and price discovery has begun to extend into uncharted territory.But unlike previous vertical breakouts, the current situation is more like a methodical technical accumulation – think of it as a build-up before a potentially decisive move.
In this article, we’ll break down the key metrics, statistical insights, and structural aspects to give us a picture of possible future directions.
Key points overview:
-
price discovery stage: Bitcoin is in the early price discovery stage, but has not yet seen the vertical frenzy of a full-scale breakout, and is building a consolidation bottom in preparation for a potential accelerated rise.
-
volatility awakening: During the recent rally, a fractal pattern showed volatility peaking near 20, suggesting renewed energy could surge above 30, leading to strong upward momentum.
-
$117,000 Structural Support: The control point forms a resilient “volume support level” with good consolidation potential before the next round of strong gains.
-
short term holder confidence: Holders are more determined to defend their cost base than in previous rallies, positioning the $140,000-$150,000 range as the next major profitability threshold.
price discovery
“Price Discovery”Refers to the process by which Bitcoin breaks through all-time highs and regains value.From a technical perspective, price discovery is when the market moves into an area with no historical resistance – essentially, a completely new state of affairs driven purely by demand.
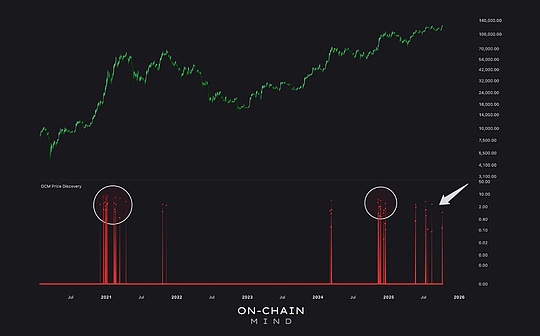
To track this I usedA price discovery indicator that measures Bitcoin price as a percentage of its previous all-time high (ATH).Whenever Bitcoin hits a new all-time high (ATH), the indicator resets and begins measuring incremental moves from that level.
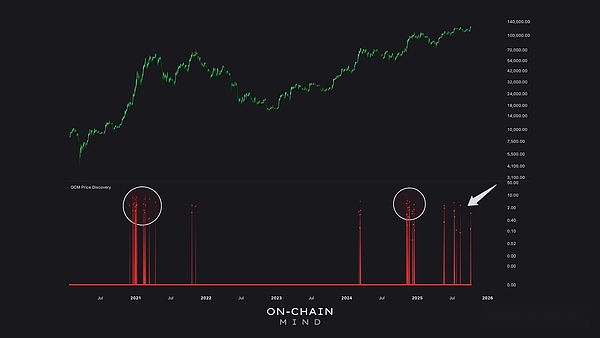
Bitcoin has begun to climb to new highs, but we have yet to see the “gathering” seen in early 2021 and late 2024 that typically heralds a full-blown breakout.
Bitcoin recently re-entered the price discovery phase, breaking out of its previous all-time high.But unlike November 2024’s frenetic surge or 2021’s bull market peak, this time it feels like it’s poised to go—like a spring about to be released.
This indicator quantifies this: it resets every time a new high is made and measures the percentage extension above it.This means it has no historical reference – price discovery occurs without prior structures existing, making it a pure reflection of market sentiment.It is visualized as a color gradient that highlights the scale of price discovery and depicts the exploration into unknown territories.
This early stage is crucial.It suggests the market is expanding – buyers are returning, but we’re not yet seeing the typical “gathering” pattern, which means the frenzied demand driving prices significantly higher hasn’t quite ignited yet.
energy beneath the surface
Volatility is often the harbinger of major market trends.The Volatility Fractal Indicator tracks the rhythm and intensity of market fluctuations across multiple time frames..Think of it as measuring the “energy” that is building up beneath the surface.
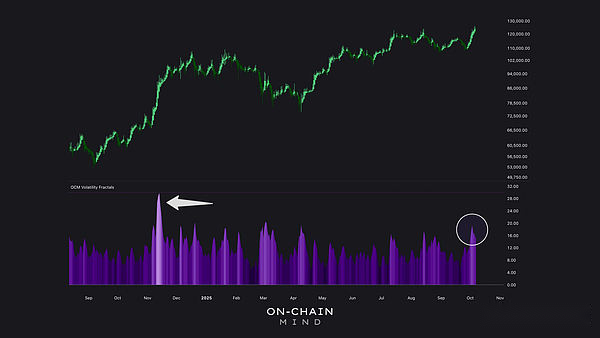
The current fractal indicator is bullish but has not yet broken out.Continued momentum could push Bitcoin to major price discovery levels like the one in November 2024.
recent,The indicator surged to near 20 in the latest leg of gains, indicating that the market is finally starting to recover.Historically,When the volatility fractal enters the 30 range, it often signals strong upward momentum.——This momentum will push Bitcoin into a surge stage.
Overall, fractal spikes indicate that buyers and sellers are actively engaging at new levels, and continued volatility expansion like this could fuel the next major uptick in price.
The current view of fractals furthers this understanding: short-term peaks often herald longer swings.As global liquidity eases, volatility is expected to amplify demand and potentially accelerate the price discovery process.
Where is the real gravity?
Short-term price levels and liquidity are just as important as overall market energy.Local Volume Distribution Chart (LVP)Volume is plotted at different price levels over a given time period (in this case, the past 120 days), revealing the “center of gravity.”
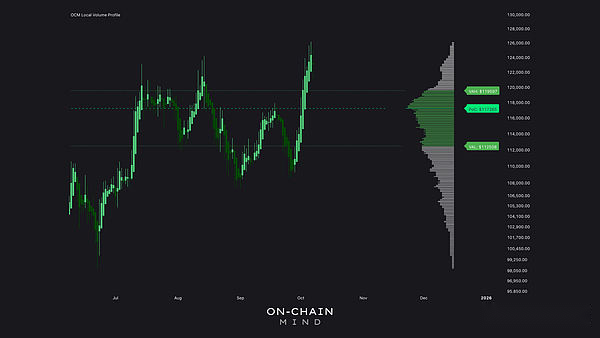
The “control point” is located at $117,000, a key structural level.This volume reflects prior value agreement, which is typically retested before moving higher.A pullback here in the near term could signal a healthy consolidation, absorbing supply ahead of an expansion.
Point of Control (POC) – the price level with the highest trading volume –Located around $117,000.This is a structural support zone that represents a price range where buyers and sellers have previously agreed on value.
Current impact:
-
A pullback back to support often provides a healthy area of consolidation before a new uptrend begins.
-
High volume areas act as anchors where market participants have confidence in the price.
-
If a callback occurs,$117,000 is the first key support level to watch, suggesting liquidity could absorb selling pressure.
signal in noise
Short-term holders (STH) are wallets that have transferred tokens within the past 155 days, they can provide key insights into market psychology.Their behavior often signals a turning point in the market—a sell-off at bottom, or extreme enthusiasm near a top.
The Short-term Holder Cost Band indicator plots the average cost basis of these holders and delineates value and risk zones:
-
low green area: Deep value zone, when Bitcoin’s cost basis relative to short-term holders is often severely undervalued.
-
middle yellow area: Bull market equilibrium zone, where prices are consistent with average holder cost.
-
Orange/red upper area: An increase in unrealized profits indicates allocation risk.
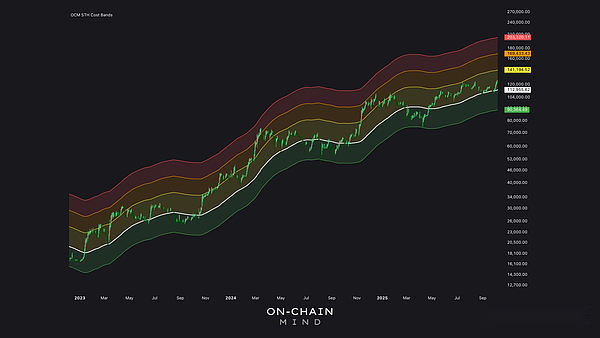
Bitcoin has recently strongly defended the realized price of STH, demonstrating the confidence of buyers.The next test: the orange range of $141,000.A breakout of this range means the profit zone is overheated; as energy builds, things could unfold quickly.
Bitcoin’s recent strong defense of its $100,000 cost base is a positive sign that buyers are determined to enter the market.The next key test isOrange range of $141,000, from a historical perspective, if it can break through this range, the rally will begin to accelerate.
And as market volatility intensifies, that breakthrough could come within weeks rather than months.
short term statistical perspective
Cost bands provide a behavioral perspective, whileShort-term holder MVRV (market capitalization to realized value ratio) enhances statistical rigor.By combining it with standard deviation analysis, we can quantify how far unrealized profits or losses deviate from historical norms.
Pink overlays at +3 and +4 sigma represent rare upside extremes, where deviations from the norm often precede reversals as profits for short-term holders become too tempting to resist.
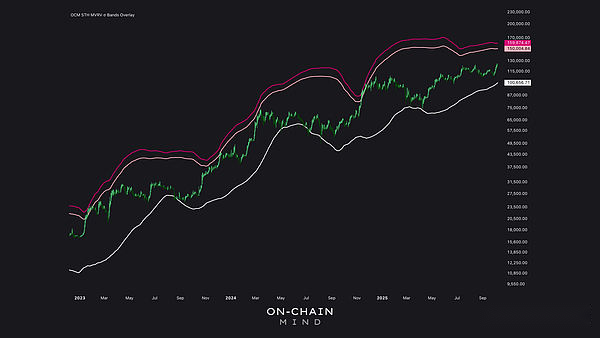
Prices can continue to rise, but the area around $150,000 is where on-chain signals and statistical thresholds converge, signaling potential significant resistance.
Currently, the +3 sigma level is located atAround $150,000, suggesting it could be in overbought territory by the end of the year.This provides the basis for Bitcoin’s strong rise to approx.Around $130,000Plenty of space is left.
However,The range of $140,000 to $150,000 is particularly critical and is the intersection of factors..Here, cost bands and sigma boundaries overlap, potentially causing market pauses to test whether on-chain valuations fit within the broader market structure.
Looking to the future
Taken together, these indicators clearly indicate:Bitcoin is transitioning from a consolidation phase to a phase where price discovery may accelerate.
Strong structural support–Buyers are defending key areas, volatility is awakening, and liquidity conditions are tilted to the upside.However,Price discovery is rarely linear.Large pullbacks typically hit liquidity above previous highs, and brief pullbacks are a natural part of this phase.Importantly, the underlying fundamentals currently look healthier than the previous peak, providing a more favorable environment for the next leg up.
This is the early price discovery mechanism at work—Demand is beginning to emerge, but full prosperity is yet to come.The real key is not just the new heights Bitcoin may reach, but the resilient structure that is forming beneath its surface.The $140,000 to $150,000 range remains a key area, where short-term profits and statistical extremes converge, the possibility of a natural pause or consolidation is greater.
From this perspective,The development of Bitcoin seems to be less of a bubble and more of a foundation.The market is testing its limits while also respecting structural thresholds – a balance that suggests its growth is driven by sustainable factors rather than speculation driven by hype.
To me, this is exactly the structure I want to see.