Author: Michael Nadeau, founder of The DeFi Report; Translation: Bitchain Vision xiaozou
Standard Chartered Bank released a report titled “Ethereum’s Midlife Crisis” last month, which sparked heated discussion.The report estimates that Base caused Ethereum’s market value to evaporate $50 billion and “take away GDP”, thus lowering its year-end price target from $10,000 to $4,000.This brings up a core question: Did Standard Chartered misjudgment ETH at the bottom of the L2 “J curve”?Or will the structural recession continue?
In this article, we will re-examine Standard Chartered’s conclusions and present our own opinions.
1,BaseWith Ethereum“Partnership“
Suppose you are Ethereum and I am Base.We are all building critical infrastructure for web3.One day I suggest to you: Why not work together with it when building another L1?
AsBaseMy cooperation needs are:
Share Ethereum Security and Settlement Layer (the cost of self-built verifiers is too high)
Establish native cross-chain bridge access to Ethereum users and assets
Share liquidity and developer ecosystem
Reduce operating costs
compatibleEVMand surrounding infrastructure
As Ethereum, you want to:
passCoinbaseGet new users through channels
promoteETHRequirements (transaction and on-chain services)
Receive enterprise-level customer feedback
Generate fee income for validators
Improve throughput and user experience
The two sides form a synergistic effect of 1+1>3.Now two years have passed, let us use on-chain data to verify the results.
2,BaseEconomic and on-chain data
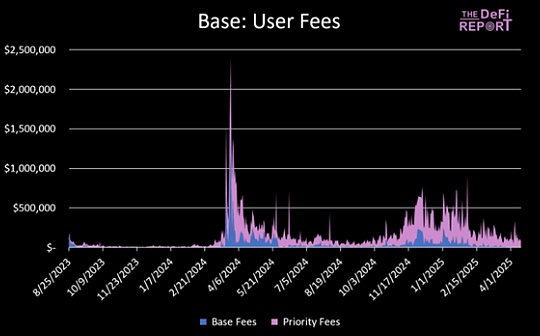
User Fees
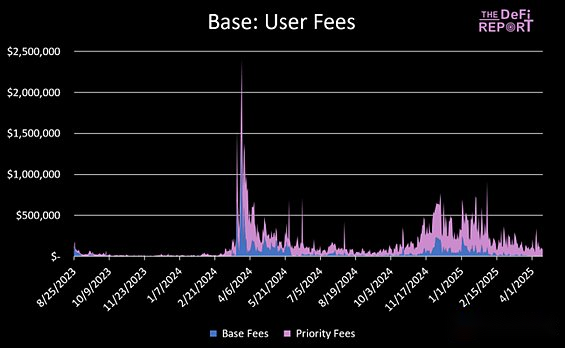
Since its inception, Base has generated a total of $24.8 million in base fees and $81.9 million in priority fees.In 2024, Base revenue ($74 million) accounted for 1.1% of Coinbase’s total annual revenue.
Base is currently the fastest-growing and most profitable Ethereum L2, launched two years later than its biggest competitor Arbitrum.
Base GDP
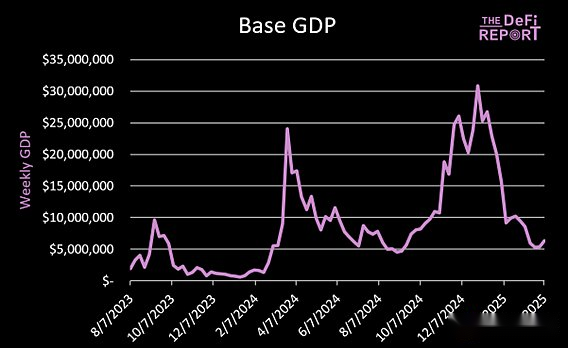
Base’s on-chain applications generate a total of US$768 million in fees (cumulative “GDP”), and its main contributors include DeFi protocols such as Uniswap and Aerodrome.
“GDP” measures the fees paid by end users for using on-chain applications (excluding gas fees).
Average daily new address
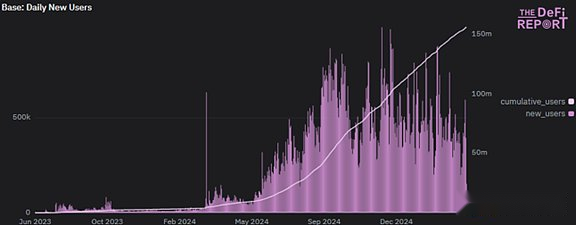
In the past 30 days, Base has added an average of 412,000 new addresses per day.Since its launch in August 2023, Base has attracted a total of 155 million address interactions.Base is diverting new users to the Ethereum ecosystem.
BasebridgingETH
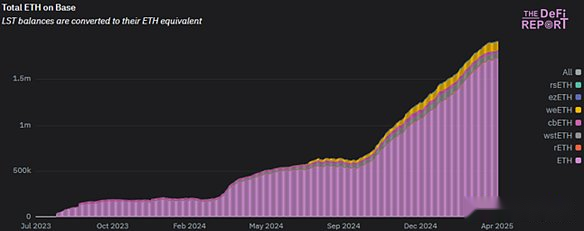
Currently, there are 1.917 million ETH (including LST) on the Base chain, accounting for 1.6% of the circulation, creating new demand for ETH.
Daily average bridge assets
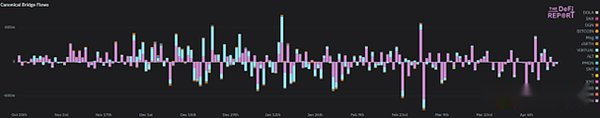
Through the native cross-chain bridge, US$50 million to US$200 million of assets flow between L1/L2 every day (ETH accounts for 80%).In the past 30 days, $503 million of assets have flowed back to Ethereum from Base.In the past 90 days, US$3 billion of assets have flowed back to Ethereum from Base, confirming that Ethereum is still a cross-chain hub.
Stablecoin supply
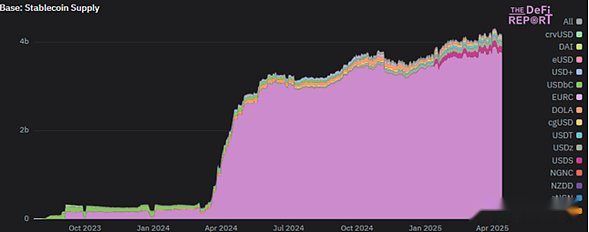
The stock of stablecoins on the Base chain reached US$4.2 billion (USDC accounts for 91%), with a total locked position value of US$9.9 billion, of which 6 billion is native assets and 3.3 billion comes from Ethereum cross-chain.This creates more application scenarios for Ethereum.
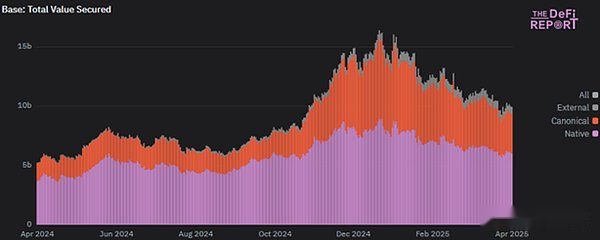
Base is currently valued at $9.9 billion.Of this, $6 billion is “native” assets, which means that these assets are issued on Base.$3.3 billion is “canonical” assets, meaning that these assets are bridged from Ethereum.$600 million is considered “external” assets, meaning that these assets are bridging from other chains.
Similarly, Base creates a net new demand for ETH through native tokenized assets.
In short, Base has used Ethereum in less than two years:
• Become the largest and fastest growing L2, earning $106 million in user fees.
• Introduced 157 million new addresses for Ethereum (including some L1 users migration).
• Build an application ecosystem that incurs US$768 million in fees.
• 1.91 million ETHs cross-chain, creating additional on-chain service demand.
• Increase the value of US$4 billion (Coinbase holds approximately 50% of USDC).
• Issuing $6 billion in native assets, while introducing $3.3 billion in Ethereum assets.
We believe that Ethereum has achieved a cooperative value of 1+1=3 here.But how much benefit Ethereum itself?
3,BaseFor Ethereum“Safety Franchise”Contributions
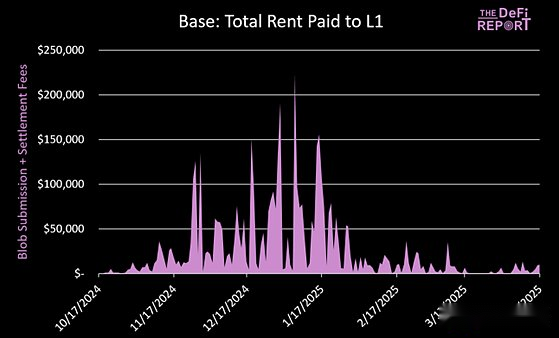
Base has paid a total of US$4.5 million in blobs and settlement fees (destroyed), and the on-chain profit margin has reached 91% in the past six months (excluding off-chain costs).
It should be noted that Base pays a total of $24 million in L1 fees, 80% of which occurred before the implementation of EIP4844 (a cheaper blob), and our analysis does not include the previous call data stage.
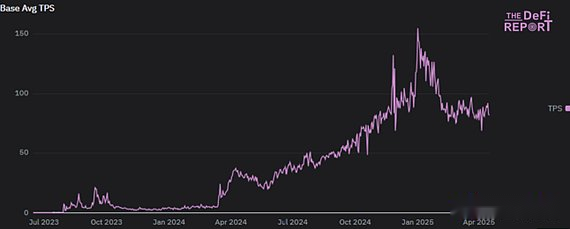
Currently, Base processes an average of 93 TPS, effectively expanding Ethereum capacity.
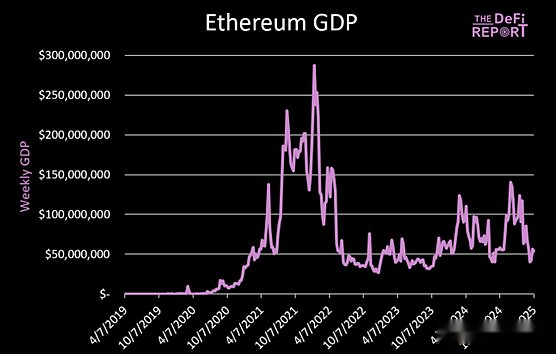
Since Base went online in August 2023, Ethereum’s weekly GDP has increased by 75%, but it is still 80% lower than its peak at the beginning of 2022.Currently, the daily GDP of L1 application is US$57 million, while the average weekly GDP of Base application is US$6.8 million.
Back to the core question: Does Base “steal” Ethereum GDP?
The answer is yes!
This is exactly what the L2 roadmap means.Top applications (such as Uniswap, Aave) are expanding towards Base, and new projects (such as Aerodrome) directly choose Base instead of L1.The migration of users to L2 has led to a decrease in L1 handling fees and ETH combustion, and Ethereum is turning to a more enterprise/B2B business model.
Only when L2 cannot fill the gap with blob fees in the future will this constitute Ethereum’s “bug”.
4,BaseGrowth forecast andETHValue Capture
Based on the current data, we believe that Ethereum is investing in the long-term future through the L2 roadmap, sacrificing GDP, handling fees and ETH burning in the short term, hoping that Base can expand its scale, build replicable templates (traditional finance?), and promote positive development of the ecosystem.
Current Situation Analysis:
• L2 currently processes approximately 165 TPS, and needs to compete for blob space.
• 3-4 L2s continue to fill the current 3 target blobs per block (maximum 6). Whenever this happens, L2 bids to increase the cost.
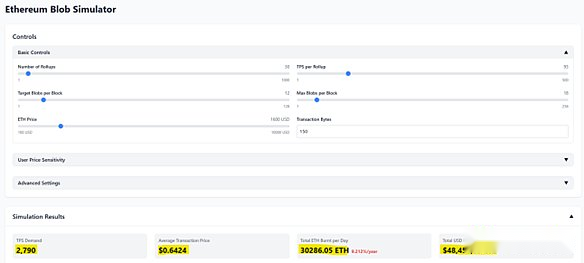
• Target blobs/blocks are currently 3 (up to 6), but will be increased to 6 (up to 9 blobs/blocks) via Pectra next month.Therefore, in the initial scenario analysis, we assume that the target is 6 blobs and up to 9 blobs.
• We are using a Blob emulator created by Tim Robinson.
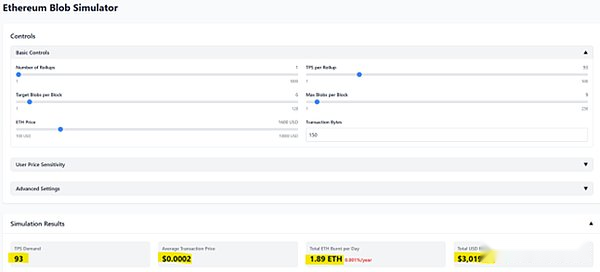
As can be seen from the above figure, the current state has little impact on the Ethereum economy, and the average L2 fee is $0.0002.
A 5-fold increase in Base TPS will result in a slightly higher L2 fee, while bringing more value to Ethereum L1 (annualized $24.5 million).
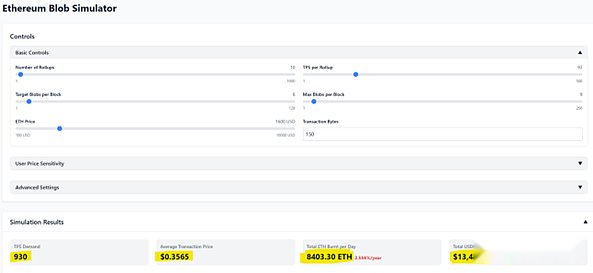
A 10-fold increase in Base TPS will lead to a 200-fold increase in L1’s annualized revenue to US$4.9 billion (verified users are happy to see).
But we also created another problem: the L2 average fee will rise to $0.35 (unacceptable).
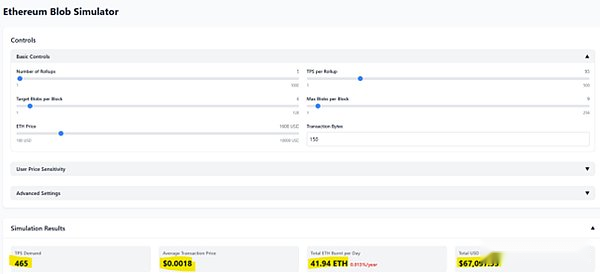
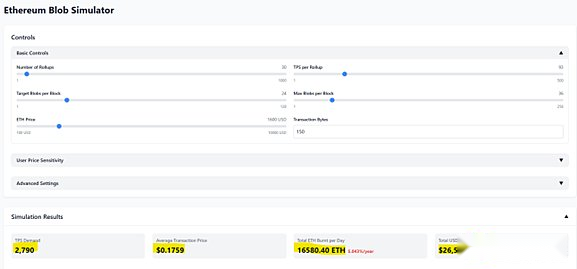
PeerDAS and Fusaka upgrades (expected to be Q3/Q4 this year) will raise the blob lift/block to 12 (the final target is 48, and the maximum limit is 72).Assume that Base TPS is increased by 10 times and Fusaka is initially upgraded:
• The average L2 fee can be controlled at USD 0.0018
• L1 annualized revenue of US$48.9 million
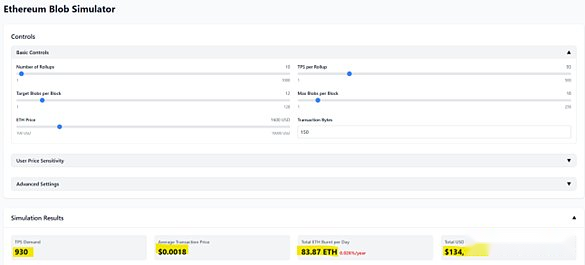
If Arbitrum and Optimism also achieve 10 times expansion during the same period:
 • L1 annualized revenue can reach US$17.7 billion (double its peak in nearly 2021)
• But again, we created a bottleneck with the average L2 cost/trade rising to $0.64.This doesn’t work.
Let’s optimistically estimate that the target blobs will increase to 24 in one year:
• L1 annualized revenue fell to $9.6 billion
• The average L2 fee is still $0.17
To control the L2 average fee below US$0.02, 33 target blobs/blocks are required. At this time, L1’s annualized revenue is only US$1.4 billion – just the same as the actual revenue in the past 365 days.
summary:
We try to simplify the analysis model as much as possible, aiming to clarify two core mechanisms: 1) The impact of the increase in L2 transaction volume per second (TPS) on blob pricing; 2) The transmission effect of the increase in L1 target blob/block number on the Ethereum economic model and L2 user fees.In fact, we fully recognize the dynamics and unpredictability of the market environment – in the near future, there may be hundreds of L2s competing for the blob space at the same time.
We are convinced that L1 will still carry a large amount of on-chain activities, continuously generate fee income and promote ETH destruction.However, the specific application scenarios and transaction scale are still unclear.
According to the simulator deduction results (assuming that all three L2s reach the current base 10 times TPS), when the total TPS of L2 reaches 2,790, even if the Pectra technology upgrade is completed, the Ethereum network will still face overload pressure (at this time, the cost of L2 single transaction reaches US$0.35).
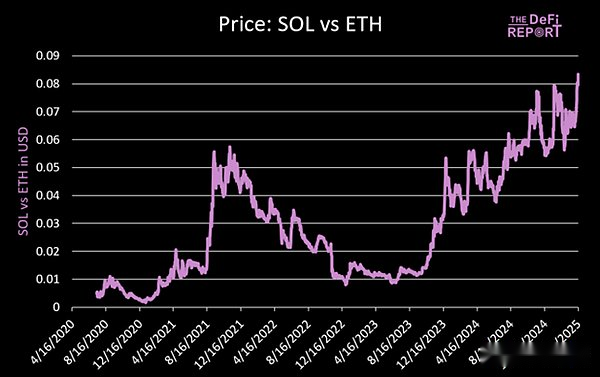
In comparison, Solana has been stably processing 1,078 TPS in the past 90 days, with an average fee of only US$0.016 (including basic fee + priority fee), and the actual user fee is lower – because its network adopts a dynamic pricing mechanism by transaction type, and its performance upgrade solution Firedancer has not yet been officially launched.
5, conclusion
“There is no perfect solution, only trade-offs” is especially applicable here.Base started quickly through the L2 model and is currently receiving ideal returns, but it also binds itself to an uncontrollable Ethereum expansion route, which may face “supplier lock-in” and technical debt risks.
Ethereum seems to have acquired enterprise-level customers by sacrificing L1 fees, creating new demands for ETH and a better user experience.But whether long-term economic relations are sustainable is questionable—scenario analysis shows that expansion bottlenecks may continue.If L2 cannot expand rapidly, additional ETH may be issued to maintain validator returns (the ETH supply after EIP4844 has changed from deflation to possibly exceeding BTC).
We believe Base is satisfied with the current situation, but if Ethereum blob is not scalable, it may seek alternatives such as Celestia.Ethereum urgently needs to shift culture from “value recognition” to a “safety-as-a-service” business model for enterprises.
Back to the original question: Did Standard Chartered misjudgment at the bottom of the “L2 J-shaped curve”?We believe that the structural recession of Ethereum fundamentals will continue in the short term.Although market sentiment may be improved with traditional financials, there is a lack of fundamental improvement catalysts.As can be seen from the picture below, there is still a long way to go.